 Joseph Gomez, Sr. Investment Advisor and Portfolio Manager
I just paid $4.29/gal for premium fuel in Coral Gables, Florida. How much are you paying in your part of the country or world? (Please use our comment section below.) This is one of the drawbacks of a strong(er) economy.
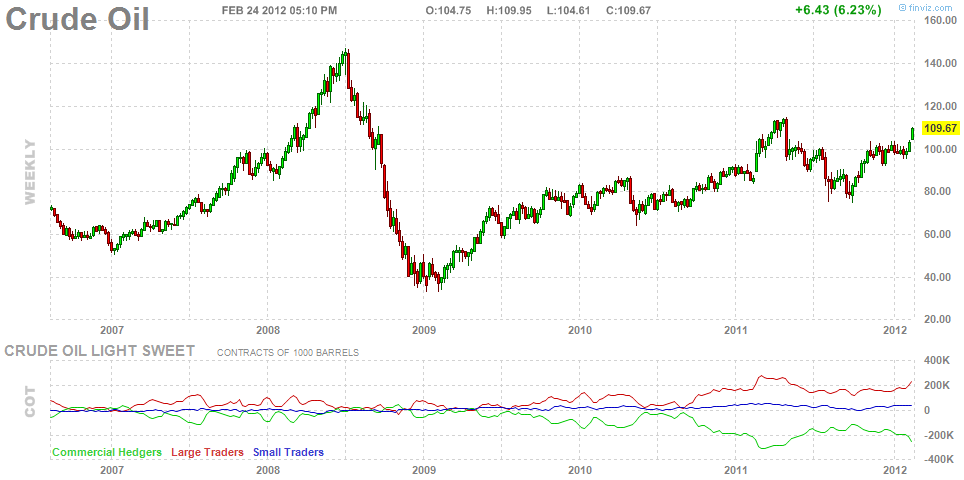
On many occasions during our Investment Committee meetings, I opined on the resiliency of oil prices despite all the economic uncertainty. The price of crude stubbornly held the $95-$100 level throughout much of 2011 despite a feeble recovery in the U.S., a self-imposed austerity plan in Europe and a slow-down in China. It was pretty clear to me that once the global economy improved, the price of oil would resume it’s upward trend. Now add to that backdrop of improved economic activity, the possibility of military action in the Middle East (Israeli attacks on Iran), and there is potential for a historic high in oil prices in our future.
Almost every industry is somehow impacted by rising oil and gasoline prices — some more significantly than others. As oil and gas prices continue to climb, consumers are likely to reduce their overall discretionary spending. As in the past, rising gas prices will result in consumers cutting back on their amount of driving and travel in general. This will have a significant impact on the summer travel economy. A few industries that are negatively affected are consumer discretionary industries, such as autos, retailers, hotels, restaurants, shipping and electric utilities. Industries that benefit are alternative energy, refining, and exploration equipment.
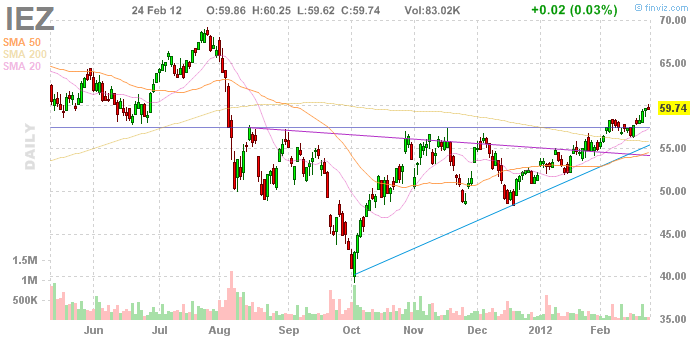
At Alhambra, we will be positioning our accounts accordingly. It should be noted that each industry will have winners and losers despite higher oil prices. One play in our client accounts that I’m fond of is the Dow Jones US Oil Equipment Index (IEZ). IEZ is up over 15% so far this year.
The fourth quarter earnings season ended this week with Wal-Mart’s (WMT) report on Tuesday. The percentage of companies that beat analyst earnings estimates this season was 60.4%. This is just below the reading from the prior earnings season and 1.6 percentage points below the historical average of 62%.
A major positive for the market is how strong breadth has been recently. Not only are breadth readings for most sectors at or near new highs, but the A/D (Advance/Decline) lines have also been repeatedly making new highs for the last few weeks. The only two sectors where this is not the case are Telecom Services and Utilities, which are again both defensive in nature.
With the market at fresh new highs, you’d think sentiment might be getting a bit too bullish, which is a contrarian indicator. However, the AAII Bullish Sentiment reading declined slightly over the last week as well, and it’s well below the level it was at in early 2011 just before the correction started. With a current reading of 43.6%, AAII Bullish Sentiment is just 3.6 percentage points above its long-term average.
Below you’ll find an economic calendar, key interest rates and a list of new highs from last week.
Have a pleasant and productive week.
New Highs from last week
| Ticker | Company | Sector | Industry | P/E | Price |
| MA | Mastercard Incorporated | Services | Business Services | 28.02 | 415.61 |
| LMT | Lockheed Martin Corporation | Industrial Goods | Aerospace/Defense Products & Services | 11.48 | 89.53 |
| HOG | Harley-Davidson, Inc. | Consumer Goods | Recreational Vehicles | 20.36 | 47.04 |
| MRO | Marathon Oil Corporation | Basic Materials | Oil & Gas Refining & Marketing | 14.59 | 35.01 |
| TDC | Teradata Corporation | Technology | Diversified Computer Systems | 31.94 | 65.48 |
| ECL | Ecolab Inc. | Consumer Goods | Cleaning Products | 29.29 | 62.69 |
| DFS | Discover Financial Services | Financial | Credit Services | 7.45 | 30.19 |
| EIX | Edison International | Utilities | Electric Utilities | 14.32 | 42.23 |
| PG | Procter & Gamble Co. | Consumer Goods | Personal Products | 19.62 | 66.71 |
| V | Visa, Inc. | Services | Business Services | 31.01 | 117.54 |
| ABT | Abbott Laboratories | Healthcare | Drug Manufacturers – Major | 18.9 | 56.7 |
| CAT | Caterpillar Inc. | Industrial Goods | Farm & Construction Machinery | 15.68 | 116 |
| PM | Philip Morris International, Inc. | Consumer Goods | Cigarettes | 17.12 | 83.02 |
| SE | Spectra Energy Corp. | Basic Materials | Oil & Gas Pipelines | 17.83 | 31.73 |
| LTD | Limited Brands, Inc. | Services | Apparel Stores | 15.95 | 46.26 |
| MJN | Mead Johnson Nutrition Company | Consumer Goods | Processed & Packaged Goods | 31.46 | 78.02 |
| LSI | LSI Corporation | Technology | Semiconductor – Specialized | 56.67 | 8.5 |
| SHW | The Sherwin-Williams Company | Industrial Goods | General Building Materials | 24.47 | 101.06 |
| UNH | Unitedhealth Group, Inc. | Healthcare | Health Care Plans | 11.77 | 55.65 |
| TGT | Target Corp. | Services | Discount, Variety Stores | 12.9 | 55.22 |
| ARG | Airgas Inc. | Services | Industrial Equipment Wholesale | 22.67 | 81.85 |
| AXP | American Express Company | Financial | Credit Services | 13.04 | 53.33 |
| CMG | Chipotle Mexican Grill, Inc. | Services | Restaurants | 57.31 | 387.42 |
| FISV | Fiserv, Inc. | Services | Business Services | 19.61 | 66.87 |
| VRSN | VeriSign, Inc. | Technology | Application Software | 44.81 | 37.64 |
| EBAY | eBay Inc. | Services | Catalog & Mail Order Houses | 14.72 | 36.36 |
| FAST | Fastenal Company | Industrial Goods | General Building Materials | 42.95 | 51.97 |
| FFIV | F5 Networks, Inc. | Technology | Application Software | 40.86 | 127.48 |
| PCLN | priceline.com Incorporated | Services | General Entertainment | 31.24 | 590.41 |
| CMCSA | Comcast Corporation | Services | CATV Systems | 19.46 | 29.19 |
| NWSA | News Corp. | Services | Entertainment – Diversified | 15.52 | 19.56 |
| QCOM | QUALCOMM Incorporated | Technology | Communication Equipment | 22.9 | 63.44 |
| ORLY | O’Reilly Automotive Inc. | Services | Auto Parts Stores | 23.03 | 85.67 |
Key Rates from Bloomberg.com
| CURRENT | 1 MO PRIOR | 3 MO PRIOR | 6 MO PRIOR | 1 YR PRIOR | |
|---|---|---|---|---|---|
| Fed Funds Rate | 0.11 | 0.08 | 0.08 | 0.12 | 0.16 |
| Fed Reserve Target Rate | 0.25 | 0.25 | 0.25 | 0.25 | 0.25 |
| Prime Rate | 3.25 | 3.25 | 3.25 | 3.25 | 3.25 |
| US Unemployment Rate | 8.30 | 8.50 | 8.90 | 9.10 | 9.10 |
| 1-Month Libor | 0.24 | 0.28 | 0.26 | 0.22 | 0.26 |
| 3-Month Libor | 0.49 | 0.56 | 0.51 | 0.31 | 0.31 |
Mortgage* (National Average)
| CURRENT | 1 MO PRIOR | 3 MO PRIOR | 6 MO PRIOR | 1 YR PRIOR | |
|---|---|---|---|---|---|
| 30-Year Fixed | 3.87 | 3.95 | 4.02 | 4.31 | 4.87 |
| 15-Year Fixed | 3.16 | 3.27 | 3.37 | 3.49 | 4.16 |
| 5/1-Year ARM | 2.82 | 2.90 | 2.97 | 3.09 | 3.56 |
| 1-Year ARM | 2.71 | 2.71 | 2.78 | 2.96 | 3.02 |
| 30-Year Fixed Jumbo | 4.70 | 4.54 | 4.68 | 4.90 | 5.40 |
| 15-Year Fixed Jumbo | 3.95 | 3.79 | 3.96 | 4.28 | 4.64 |
| 5/1-Year ARM Jumbo | 3.25 | 3.14 | 3.22 | 3.34 | 3.86 |
Economic Calendar by Econoday.com
Click here to sign up for our free weekly e-newsletter.


![[Report]](https://bloomberg.econoday.com/images/bloomberg-us/byconsensus_butt.gif)
![[djStar]](https://bloomberg.econoday.com/images/bloomberg-us/djstar.gif)

![[Star]](https://bloomberg.econoday.com/images/bloomberg-us/star.gif)
Stay In Touch