

A trend or perhaps out-performance can sometimes be deceiving. You’ve heard me say it before, you must be wary of time horizon. Know what you are analyzing and then look from a different perspective, discern the necessary details. We tend to like visual analysis and it will often paint a very vivid picture.
Take, for instance the performance of a very reputable company’s moderate allocation portfolio. Looking at short term performance one might be likely to jump in. There are infact many “advisors” who would blindly recommend this investment option to their prospects, based on the following first 3-4 graphs.
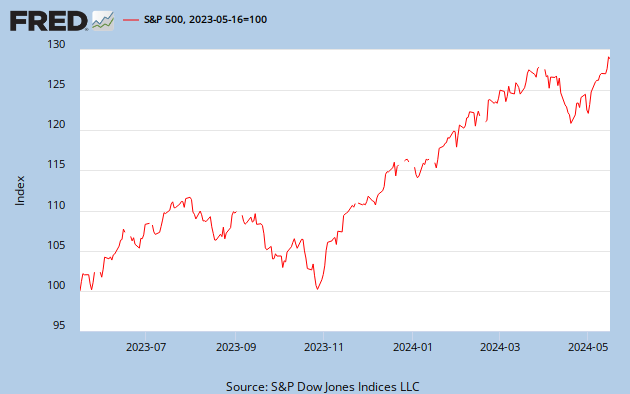
3 Month performance:

It looks great…
And how about the YTD graph or the 1Yr performance?


This is arguably the best best “Moderate” investment portfolio for your money, based on the past year. But further investigation will show that the out-performance seems to be limited to just recent out-performance. Also note the under-performance to the downside in the fall of last year. This is perhaps an indication that the fund is riskier than advertised, here’s a 3yr view.

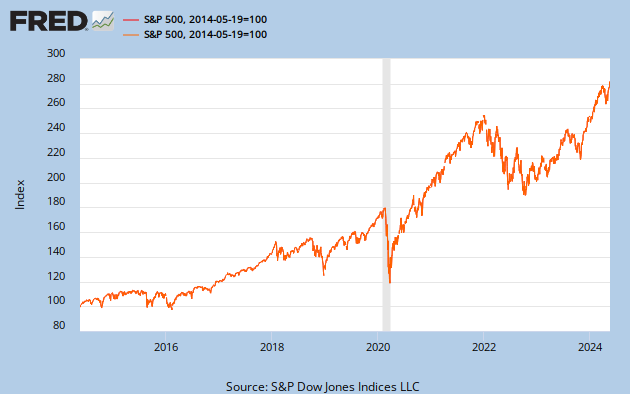
And then the 5yr, it puts it all in perspective for us. The fund was riskier than advertised, and suffered relative to its benchmark index during the recent crisis.

Looking at a longer term view, the full picture will emerge. Dodge and Cox is a very reputable firm with a solid long term performance record. They intelligently navigated the dot com bust and perhaps even the challenges of 9/11. Part of the reason they have amassed over $12bln in investor capital.

But the fund managers seemingly gave away all their 2000-2002 out-performance in the recent down turn. Is the fund just riskier than advertised? Were good managers caught off guard in 2008? Will they continue to out-perform their benchmark? Are they licking their wounds and just trying to play catch up? Is the fund’s style only appropriate for certain environments? I feel for them, these markets are certainly no piece of cake. The take-away is: be aware.
Over the past 2 years, I am often asked about the merits of Gold as an investment. My personal opinion is that Gold, as a certain percentage of one’s portfolio, is advisable. Given the recent and current environment, we have over-weighted Gold as an asset. Looking at Gold and its performance relative to stocks, one gets a good view into current policy in this country. Here is a graph of Gold relative to stocks since the beginning of the recent crisis (In the following graphs, Gold is blue and Stocks are red).
Monetary policy, negative real rates and quantitative easing have the effect of devaluing our currency. Essentially the Fed is filling in an economic hole created by the drop in unsustainable asset prices created from debt financing. This deliberate devaluation has been going on for longer than the past 5 years and is arguably one of the major causes of the crisis. Here’s the graph since the onset of the recession of 2001.

And for some perspective, Gold relative to the S&P since 1971, August 15th to be exact.

Here’s a graph from the 70’s.

Lets look at the past decade relative to the 70’s.
This begs the question, do we find ourselves in a similar situation as 1979, gold has peaked, or is this just an extended version of our 70’s experiment and we actually sit in 1975, with more instability to come?
The short term good news is that capital is coming out of gold, an unproductive asset, and going into equities. We are very wary that this could be a temporary phenomena.

Lastly lets look at the recent crisis, the policy response and its affect on certain sectors. Leading up to 2008 you can clearly see the effects of monetary policy on energy prices (Energy Sector in Red below). The same effects were seen in real estate prices (dark blue), essentially items in the bottom of Abraham Maslow’s hierarchy of needs. Inflation, flowing to the sectors with the most universal demand. Crisis hits, more monetary stimulus ensues. The consumer and tech sectors emerge in relatively good shape, perhaps the unemployment problems are merely the bifurcation we are seeing in the macro economy. Need based sectors (energy and real estate) recover as well. Financials (black line), though, have flat-lined. It is fairly obvious from where the bubble was blown. The financial sector was damaged, and the Fed is merely trying to heal. The secondary effects are higher prices for all goods, energy being the primary input needed by all.

This leads to a few question. Is energy speculative? Is their really a potential resource shortage as opined by modern day Malthusians? Is this trend likely to continue?
We are seeing financials participate in this years rally. Positive.
We are seeing money come out of Gold and Energy and go into stocks and especially financial stocks. Positive.
9 Month Chart:

But on the day Ben Bernanke delivered arguably his most important comments of the past year, gold and energy made big moves. Financials and general equity sectors followed; but the strength in gold and energy should be noted.

We are currently on hold and watching. Our allocation is baseline risk neutral. We have a slight tilt toward bullish in portfolios, the result of performance effects from the recent rally. We also have positive asymmetric exposure to the downside, resulting from the recently added hedge. We will be monitoring the markets for indications of a sustainable follow through rally or the potential for additional headwinds from fiscal policy combined with the ongoing effects of the recent crisis which continue to hamper the economy.
Click here to sign up for our free weekly e-newsletter.
For information on Alhambra Investment Partners’ money management services and global portfolio approach to capital preservation, Douglas R. Terry, CFA is reachable at: dterry@4kb.d43.myftpupload.com
Stay In Touch