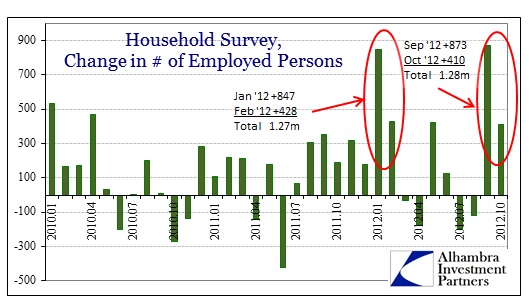
This was the second consecutive employment report that featured a large increase in employment levels estimated by the Household Survey. After September’s +873k, October’s survey yielded a gain in overall employment of +410k. While this has caused a spurt of optimism, it is actually the second time just this year we have seen this pattern ( a near exact repeat).
There was much more optimism in the beginning of 2012 as the continuous growth in the Household Survey convinced many observers that the full recovery period was finally at hand. It didn’t last to the next month, however, as the full employment picture needs to be viewed in a larger context.
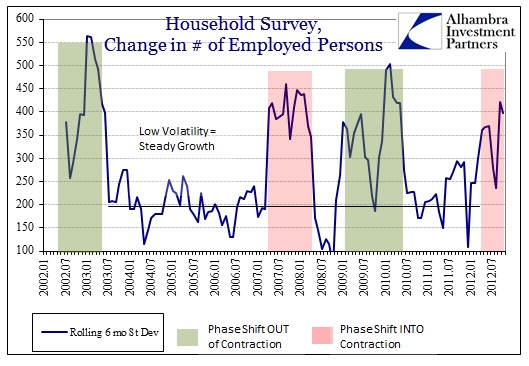
In terms of the statistical gathering of the data, to me these large swings in the Household Survey only confirm ongoing volatility in the data set. As I mentioned after last month’s report, increased variability in the survey data is consistent with an inflection in trend.
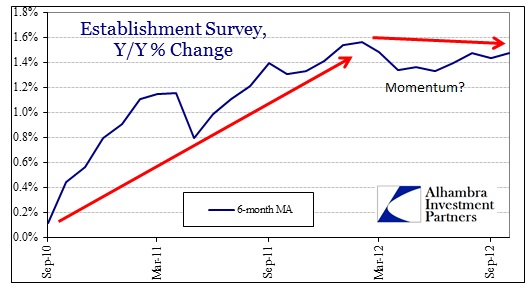
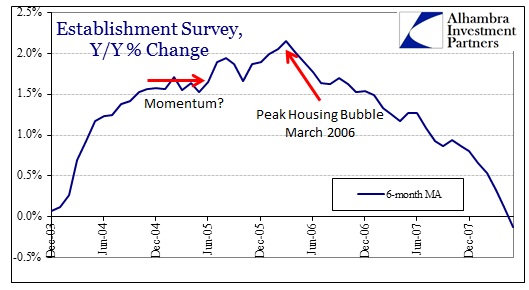
That potential shift in overall trend is captured in the Establishment Survey which, like the Household Survey, pleasantly surprised to the upside. Again, however, context is needed.
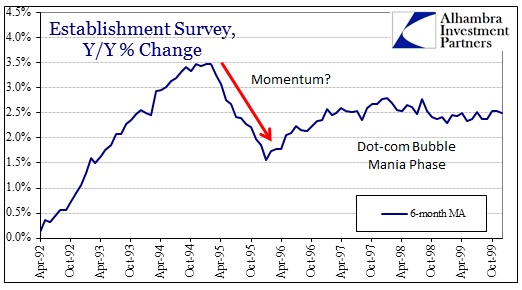
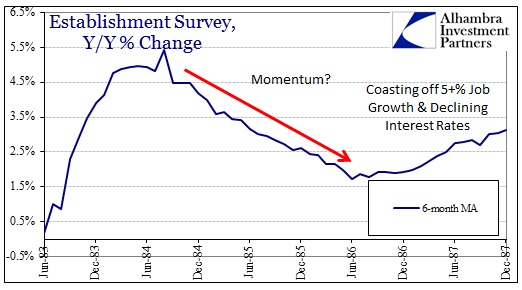
Every recovery phase finds itself at a point where forward momentum appears to be challenged (for reasons beyond the current scope of this posting). So, in context, the current shifting trend appears to be consistent with previous recovery periods.
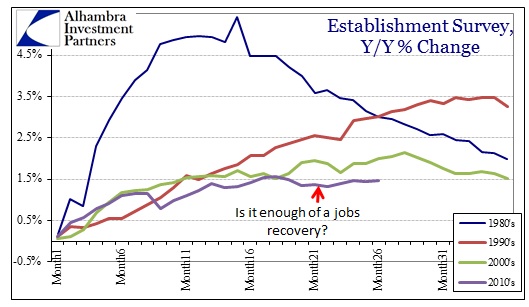
Put together in the context of generic expectations of what recoveries might look like (and this is how the statistical analysis is conducted, estimated and analyzed), the current period is noticeably lagging and lacking (not a surprise). This provides ample explanation for why we might not cheer a monthly gain of 171k (very similar to the context of the housing recovery, the scale of recovery is just no match for the scale of the preceding decline). Moving in the right direction in terms of job growth is only one element to the process, and, perhaps, not even the most important element.
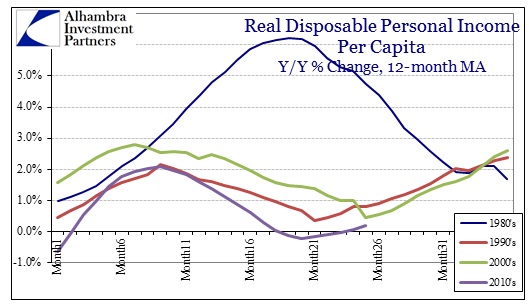
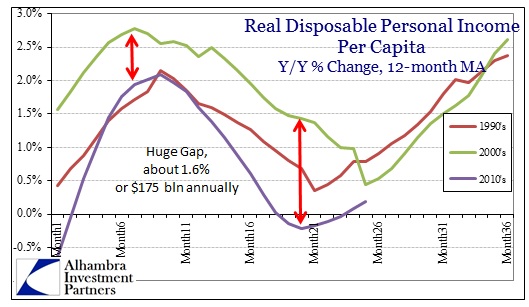
When viewed beyond the simple count of the number of employed persons, we get a much better sense of where the recovery is failing on the household side. In terms of economic health, the productive value of a job is not simply binary – whether you have a job or you don’t. The degree to which jobs provide income is the most important aspect in the analysis of economic function. We can infer that a growing or expanding job market might eventually lead to better incomes in a virtuous economic circle, but economic systems do not operate in a vaccum. There are larger factors at play and the simple count of filled jobs on the market does not appear to directly and succinctly yield a universal growth process, as this “recovery” period demonstrates in sharp contrast to the past three.
The recovery from the double dip recession of the early 1980’s is clearly different in both scale and pattern. I have said on numerous occasions that it was the last real recovery in the economic record, the chart above speaking volumes to that statement. In terms of overall pattern, the current recovery matches closely the pattern of the previous two, both in the overall beancount of the number of employed and the pattern of income generation from positive job growth. The primary difference is the scale or degree to which the current period is lagging the previous two.
It should also be pointed out that I have compared real disposable personal income (per capita) between periods and not just wage income growth. It is, then, all the more remarkable that real DPI has been so consistently below pattern because of additional elements included in that calculation, such as the explosion in gov’t transfers and the slow rebound in taxation, that have “assisted” DPI in maintaining even the weak growth track that it has. In other words, on a purely jobs-to-wages basis, the recovery is even worse.
The commonality between the past three recoveries, and the primary contrast with the mid-1980’s, is activism in Federal Reserve policy, particularly with regard to interest rates. Despite the rhetoric that low interest rates are “stimulative”, at some point on the interest curve or regime, low interest rates corrupt the economic process to the point that recoveries have undergone a dramatic shift. I have not included them here, but recoveries prior to the 1990’s feature nearly identical patterns (in the style of the 1980’s version).
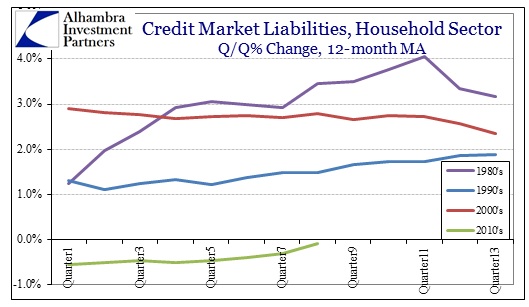
Where these processes intersect, monetary policy and corruptive recovery interference, is household usage of debt. The lack of credit production and dispersal in the current period is stark, and it highlights exactly what the Federal Reserve would like to have occurred long before 2012 and is desperately trying to spark with successive QE’s (among other goals).
The question/problem moving forward from an economic perspective is whether simple job counts are enough to maintain momentum now that it has been lost to the lagging income circulation. Are there enough positive trends in domestic business or globally that can overcome this weakness?
From a more temporally focused perspective there is more to worry about in the jobs report in that regard. Hourly wages declined in October, and average hourly earnings yielded their lowest increase in the entire recovery period. Jobs by themselves are not enough. It is always a question of not only quantity, but quality – with more needed emphasis on quality. Of the 171k purported new jobs in October (there are seasonal issues here as well, but I’ll leave that for some other day), 29k were “low end” retail trade (working at the mall), 15k were temp, 13k were services to buildings & dwellings, 5k business support services (call centers & such), 23k food services (hamburger flippers and table servers), 5k professional laundry services. That means 90,000, or more than half, were low wage-type service jobs. It is not hard to see why hourly wages would, on average, fall with such a jobs report.
Economists can debate the veracity of Okun’s Law and whether or not it has been broken, but the simple fact is that this weak recovery is in danger of losing momentum, having already underperformed by a large degree. Jobs by themselves do not convey the same amount of income growth as have previous recovery iterations, nor does the household consumer have the artificial “tailwind” of an asset bubble or robust credit expansion. All of these deficiencies are linked.

Stay In Touch