My theme for 2012 has been that something is different this year than the past two years of even substandard recovery. Recession looms and recent data has done nothing to make me think that trend is anything but hardening.
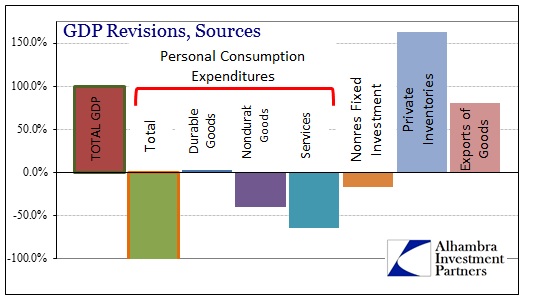
While there was some celebration over the first revision to Q3 GDP, as headline growth was revised up to 2.7% from 2.0%, the key economic internals actually went in the other direction. Most of the increase in the revision came from exports of goods (positive) and non-farm inventories (not so good). We knew that the export number would be revised higher from the September international trade report that showed an increase in the export of crude oil.
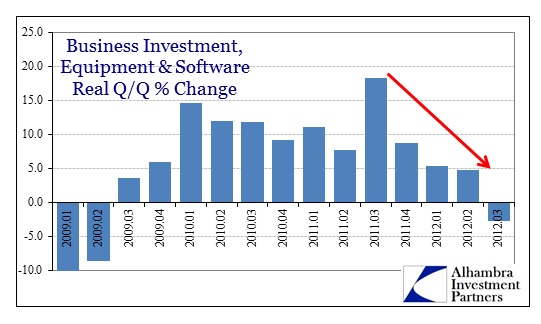
On the other side of the revision ledger, both Personal Consumption Expenditures and Business Investment outside of inventory were revised significantly lower. Business spending and investment has already been dramatically weaker in 2012, so the first revision simply added to the degree of woe.
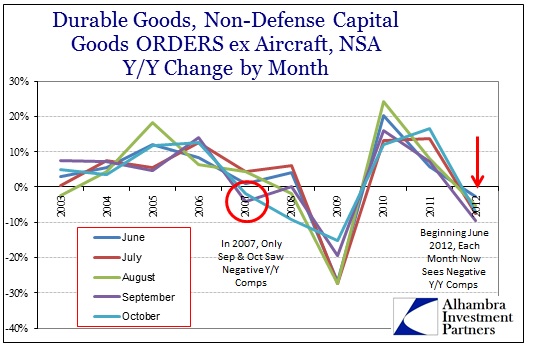
Matching this data to other series, the trend for capex in this BEA GDP analysis closely resembles the durable goods picture (especially capital goods orders and shipments). For the first time since the recovery began, business capex measured in the GDP series is negative.
None of the major subcomponents registered any significant growth in the quarter (pre or post revision). The collapse in computer spending, along with the transportation spending, again corroborates anecdotal evidence from other places – notably the disastrous earnings reports from most of the computer and tech companies with high proportions of “enterprise” business segments.
The picture that emerges again is that 2012 is clearly moving in the wrong direction, an inflection-type break from 2010 & 2011. This analysis is not just confined to a single data series nor even agency. We see this change in trend across several categories that are often correlated and intuitively related (like business investment in the GDP series collected by the BEA and the separately collected Durable Goods series estimated by the Census Bureau).
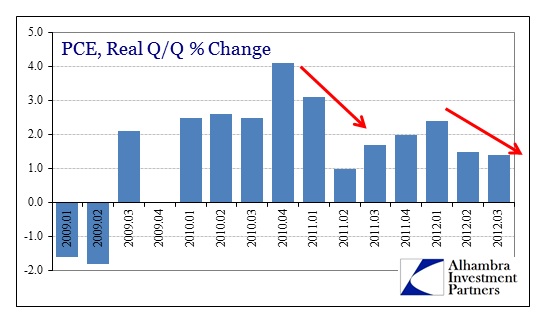
Personal Consumption Expenditures also exhibit much the same pattern, primarily with large declines in gasoline sales (nondurable goods) and health care expenditures (services) recently in the Q3 revisions. The overall track of PCE, a tepid 1.4% increase (revised) in Q3 is more representative of consumer spending retrenchment than recovery-type growth.
In 2004-05, three years after the end of the 2001 recession, PCE growth averaged 3%. Even during the weak recovery period before the real housing bubble mania, PCE growth averaged 2.9% from 2002-04. The average for 2012 is currently estimated at 1.7%.
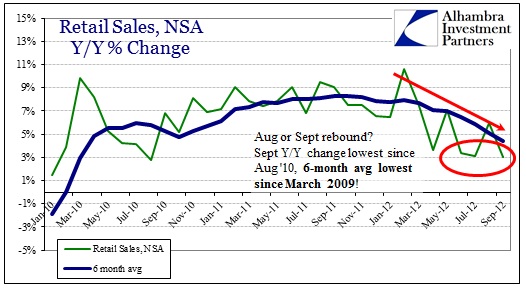
The trend in PCE expenditures matches the Y/Y picture in retail sales, rather than the reported and statistically adjusted monthly numbers. Despite a rebound in the second half of 2011, overall spending trends are consistently lower.
All this begs the question as to why 2012 has been different than the previous recovery years. For business investment and capex, there are a number of factors including propensity to borrow and spend money for stock repurchases, but there is no mistaking the growing slowdown in profitability. Businesses, particularly of larger size, have had a good run of profitability but have shied away from the investment scale we would normally expect in a robust, profit-led recovery.
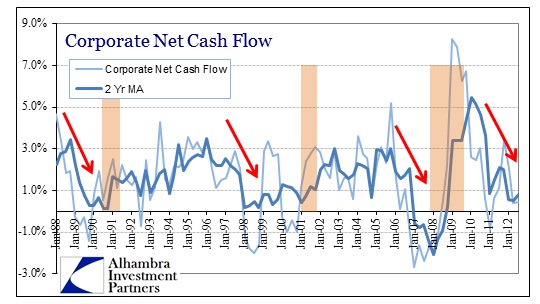
Outside of the monetary incentives that skew against capex and productive investment, cash flow may be another reason for holding back and tying up funds in longer-term, employment-rich domestic projects. Corporate businesses are often creatures of liquidity, so diminishing organic cash flow may be one reason for both the uninspiring capex climate and the timing of the trend change in business investment into 2012.
If earnings have peaked with corporate revenue in this cash flow environment, that would certainly offer a very plausible explanation not just for the reluctance of corporate managers to embrace productive spending but to actively cut back (especially Q3).
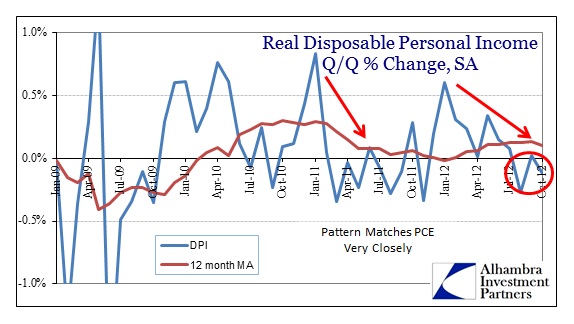
On the consumer side, there is little mystery as to the timing. Personal income has been extraordinarily weak for an economic recovery. There can be little doubt that the lack of capex cited above has played a role insofar as the manufacturing economy has not rebounded to produce sustainable wage income advancement. The service sector has likewise fallen behind. The net affect has been weak income growth that became much weaker, particularly in real terms, toward the end of QE 2 at the outset of 2011. Even that slight growth in the actual recovery period before the end of 2010 simply never returned. Real DPI has not significantly increased in the interim as the primary driver of that slight real growth in incomes in the last half of 2011 was diminishing inflationary pressures rather than employment and wage income.
The minor bounce in late 2011 turned lower again into 2012, confirming the timing of PCE and the other economic data that support a 2012 inflection thesis. And, like business investment, recent data has actually deteriorated further, as real DPI (especially when measured per capita) is again contracting month over month.
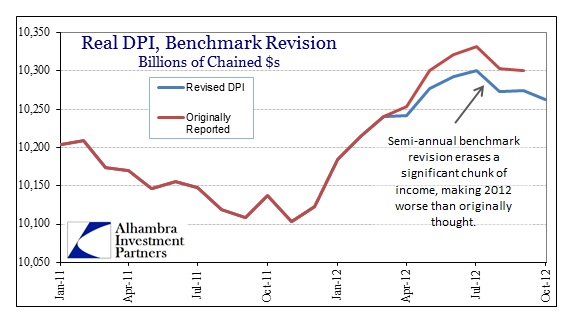
As if that wasn’t bad enough, a significant downward revision in the semi-annual benchmark essentially erased income from April onward. In other words, the BEA estimates (which center on trend-cycle benchmark assumptions) were actually too robust! The income picture in 2012 is even worse than originally thought.
This is a topic we have covered before and I will have an upcoming post on additional revisions that were made that essentially confirm what I have been saying about relying on trend-cycle analysis and similar adjusted data. From the perspective of data analysis, these statistical agencies simply over-estimate growth and progress because they assume we are in Year 3 (almost 4) of a cyclical recovery. They are finding out that Year 3 of this recovery is not much like previous recovery cycles, and therefore much of the adjusted data is simply too skewed toward growth. If they had instead selected a more fitting benchmark that matched actual conditions at the beginning of 2012 rather than just assuming historical norms (random walk statistics is really incapable of moving beyond being captured by historical data series, so this is probably too much to ask), we would not see so much downward revision. Some may see political malfeasance and a desire to paint too rosy a picture for the election, but the culprit really is bad math and flawed theory.
Beyond the statistical analysis, the data for 2012, especially recent data, clearly shows that 2012 has broken from the recovery trend of 2010 & 2011 in the most important and economically vital segments.


Stay In Touch