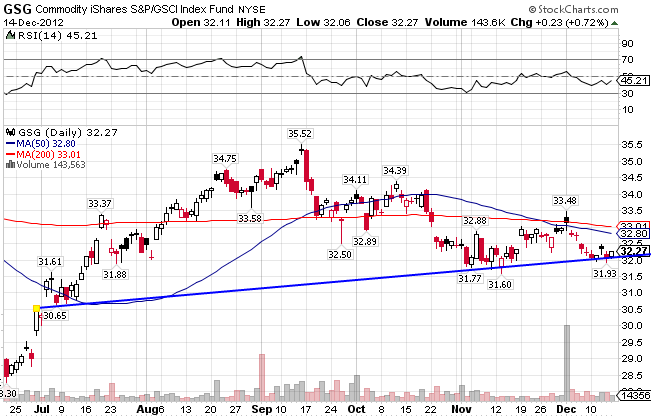
The GSCI Commodity Index ((GSG)) consists primarily of Energy (71%), but also contains Agriculture (14%), Industrial Metals (7%), Livestock (4%), and Precious Metals (4%). The index currently sits atop support but below both moving averages, and the situation is precarious at best. GSG is essentially flat for the year, down 0.06% for all of 2012.
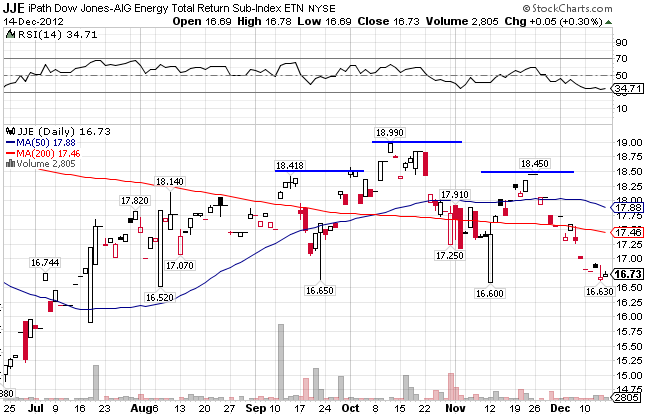
The Dow Jones-AIG Energy Total Return Index ((JJE)) consists of Natural Gas, Crude Oil, Heating Oil, and Unleaded Gas. The index formed the dreaded head and shoulders technical pattern and as a result finds itself in correction territory. It currently resides below both moving averages as well, with support at the 16.60 level. The index is down 8.36% for the year.
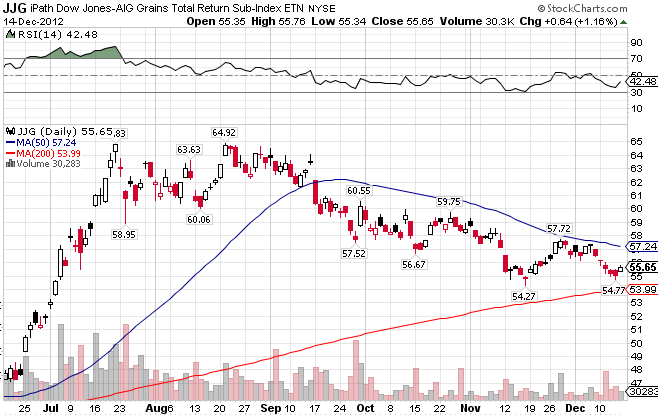
The DJ-AIG Grains Total Return Index ((JJG)) consists of Corn, Wheat, and Soybeans. Th index has been a spectacular performer in 2012, up 25.72% for the year.
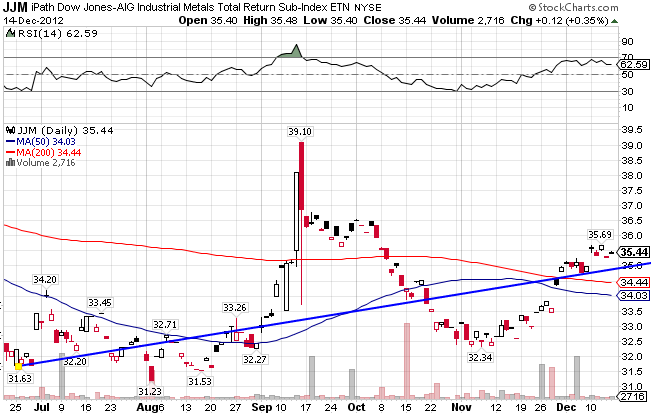
The DJ- AIG Industrial Metals Total return Index ((JJM)) includes Aluminum, Copper, Nickel, and Zinc. After spiking in September, the index quickly broke down before recovering and settling above both moving averages. JJM is up 0.74% YTD.
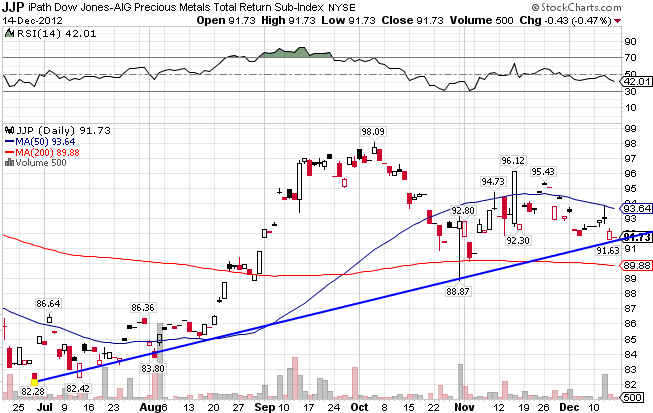
The DJ-AIG Precious Metals Index ((JJP)) includes Gold and Silver. The index is up 10.44% for all of 2012.
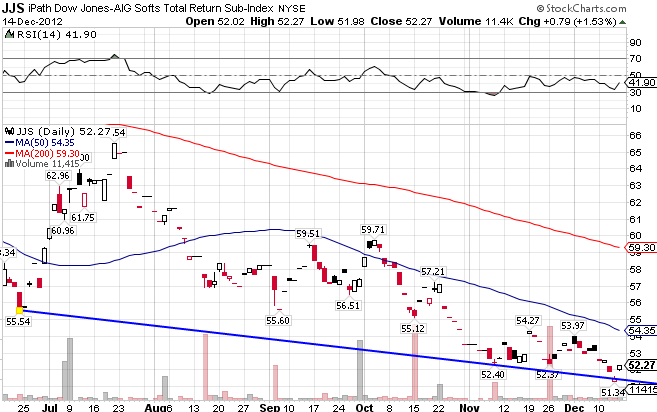
The DJ-AIG Softs Index ((JJS)) includes Coffee, Cotton, and Sugar. JJS is very weak technically. It finds itself below both MAs, and is riding its downtrend line lower. The index is down 23.29% YTD.

Stay In Touch