
The Standard & Poor’s 500 is a stock market index based on the common stock prices of the biggest 500 publicly traded American companies. The S&P 500 ((IVV)) successfully bounced off the 50-day moving average at the end of 2012 on it way to making new multi-year highs in January. However, it is quickly approaching overbought territory. Anything above 70 on the Relative Strength Index indicates overbought conditions. The index is currently at 69. Eventually the index will come back down to a level closer to 50, which most of the time means a minor sell-off in the markets. But there’s definitely no need to sound any alarms though. The S&P 500 index is up 16.08% in the last year.

The S&P 500 Value Index ((IVE)), which consists primarily of US large-cap value stocks in the financial services, industrial, and consumer cyclical industries, tend to have lower price to earnings ratios and higher dividend yields than the market as a whole. This index looks fabulous based on the charts, having broken out past the 67.50 level. Compared to the S&P 500, the index is outperforming slightly, returning 17.14% in one year.

The S&P 500 Growth Index ((IVW)), which consists primarily of US large-cap growth stocks in the tech, healthcare, and energy industries, tend to have higher earnings growth rates, higher earnings multiples, and little or no dividend yields. The index still finds itself under resistance, despite the recent surge in equities. In the last year, the index is up 14.78%, less than the overall market.

In the past few months, a short-term trend of value stocks outperforming growth stocks has emerged.

The MSCI EAFE Index ((EFA)), a global developed market index that encompasses Europe, Australasia, and the Far East, has established a nice uptrend since its lows in June. You would think with all the negative chatter surrounding China and Europe that the index would be broken, or at least under any one of its moving averages. That’s just not the case, as it seems that much of it was already priced into the EAFE. The EFA chart is actually much more bullish than that of the S&P 500. The index is up 17.94% over one year.

The MSCI EAFE Value Index ((EFV)), which consists primarily of low P/E international large-cap value stocks in the financials, energy, and communications industries, also finds itself above support at the 50 and 200-day MA and once again approaching new highs. The index is up 19.98% in the last year.

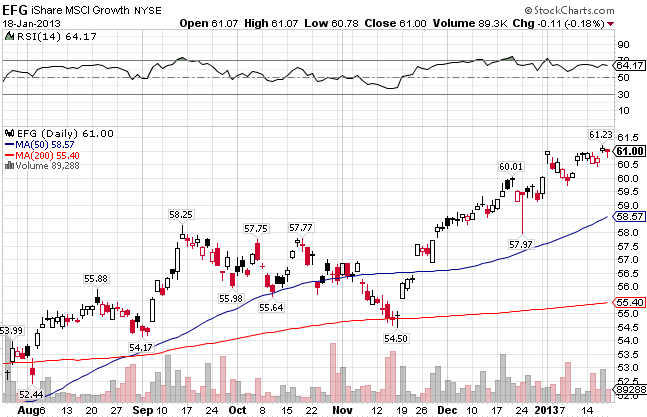
The MSCI EAFE Growth Index ((EFG)), which consists primarily of high-growth international large-cap growth stocks in the industrial, healthcare, and consumer cyclical industries, has underperformed compared to the value index, just as its American counterpart. The index is up 15.81%.
Stay In Touch