
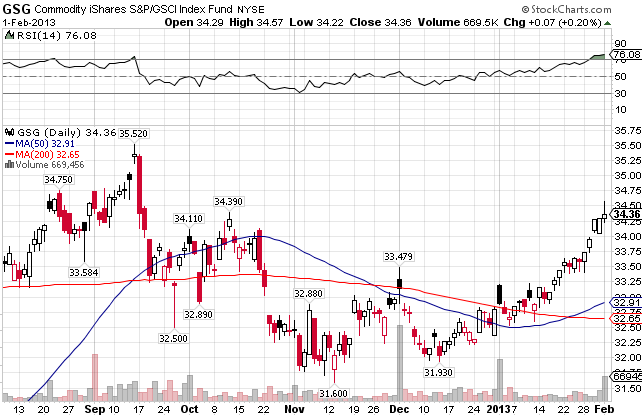
The GSCI Commodity Index ((GSG)) consists primarily of Energy (71%), but also contains Agriculture (14%), Industrial Metals (7%), Livestock (4%), and Precious Metals (4%). After breaking through both moving averages in the beginning of the year, the index broke out to the upside. The index is slightly overbought in the short-term, but given that it formed a golden cross on the charts (where the 50-day MA crosses over the 200-day MA and both slopes turn positive), the future looks bright. GSG is up 4.79% year-to-date.
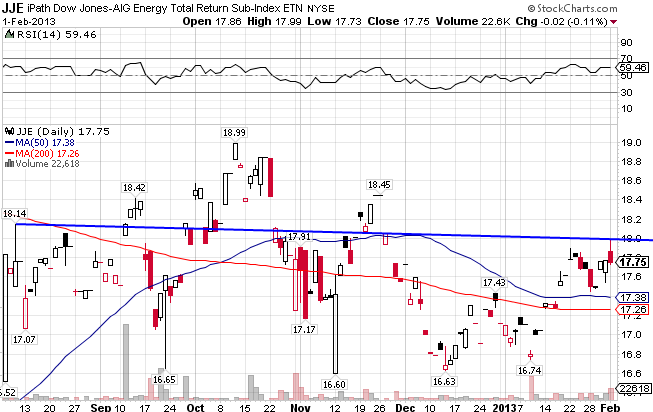
The Dow Jones-AIG Energy Total Return Index ((JJE)) consists of Natural Gas, Crude Oil, Heating Oil, and Unleaded Gas. The index formed the dreaded head and shoulders technical pattern late last year but seems to have straightened itself after falling below both moving averages. It currently resides above both moving averages, and seems likely to break out as a result. The index is up 3.68% for the year.
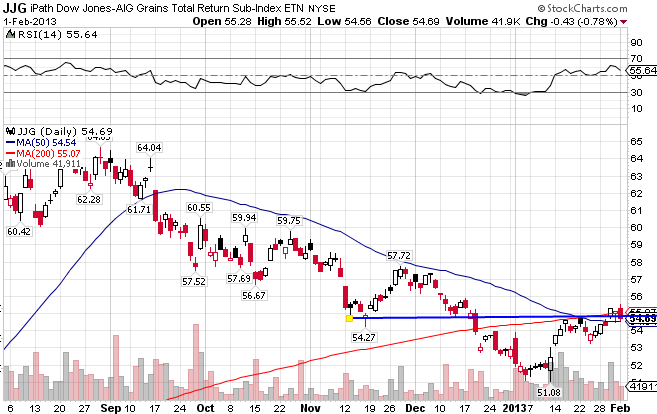
The DJ-AIG Grains Total Return Index ((JJG)) consists of Corn, Wheat, and Soybeans. The index was a spectacular performer in 2012 even after its correction at the end of the year, and it appears as if though the bottom has been reached. The index is up 3.33% so far in 2013.
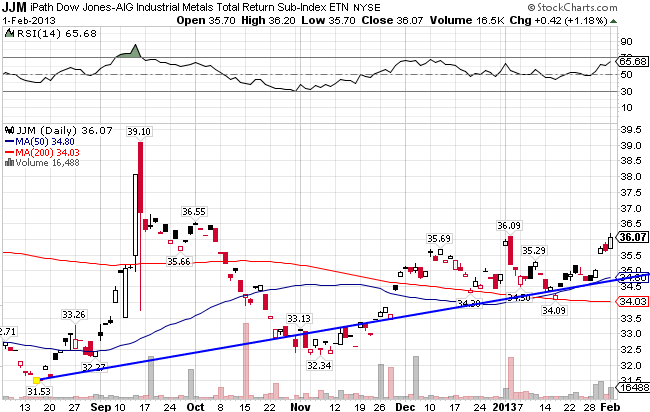
The DJ- AIG Industrial Metals Total return Index ((JJM)) includes Aluminum, Copper, Nickel, and Zinc. After spiking in September, the index quickly broke down before recovering and settling above both moving averages. It may be on the precipice of breaking out to the upside. JJM is up 3.44% YTD.
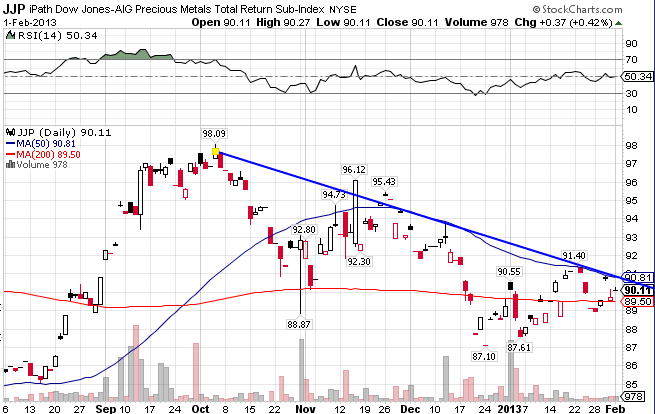
The DJ-AIG Precious Metals Index ((JJP)) includes Gold and Silver. The index is slightly underperforming the commodity space, up only 0.99% in just a little over a month.
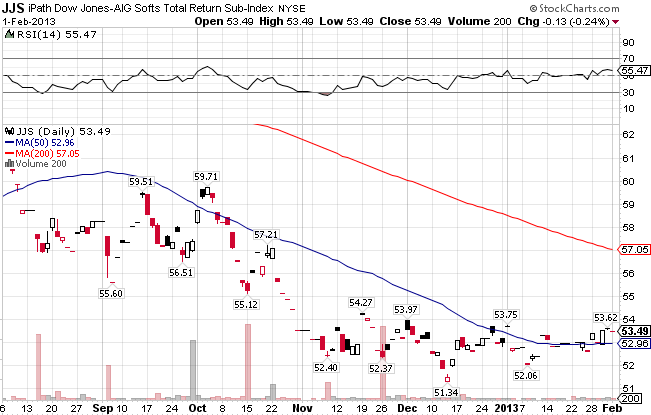
The DJ-AIG Softs Index ((JJS)) includes Coffee, Cotton, and Sugar. JJS is very weak technically. It finds itself below the 200-day MA and mired in an ugly downtrend. The index is up 0.92% YTD.
Stay In Touch