
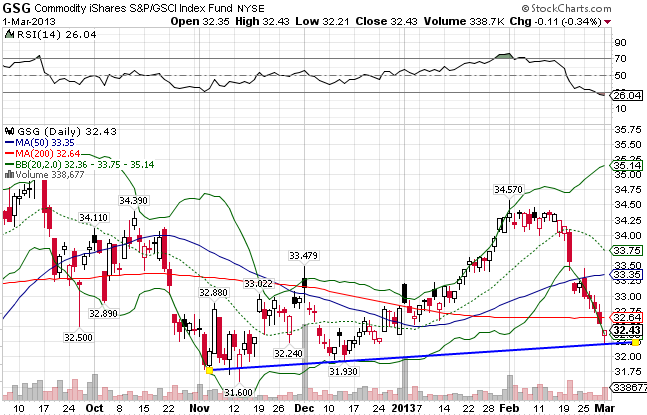
The GSCI Commodity Index ((GSG)) consists primarily of Energy (71%), but also contains Agriculture (14%), Industrial Metals (7%), Livestock (4%), and Precious Metals (4%). After breaking out January, the index staggered before finally giving way this past week, due to a strengthening US Dollar. The index broke through both moving averages on its way down, testing support at the 32.25 level. GSG is down 1.10% year-to-date.
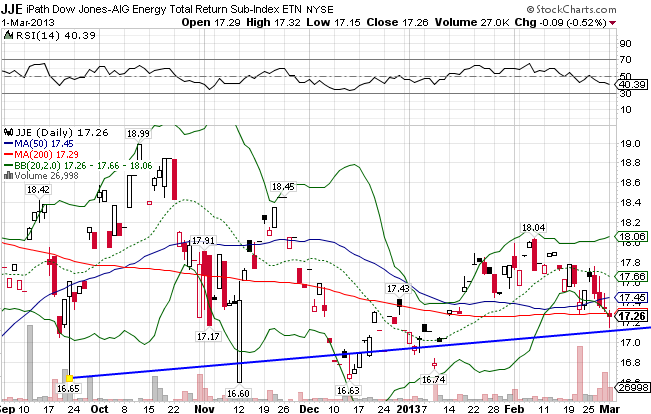
The Dow Jones-AIG Energy Total Return Index ((JJE)) consists of Natural Gas, Crude Oil, Heating Oil, and Unleaded Gas. Technically, this index is very similar to the GSCI Commodity Index. After having a false breakout in the first part of the year, the index broke down, falling below both moving averages. The index is up 0.82% for the year.
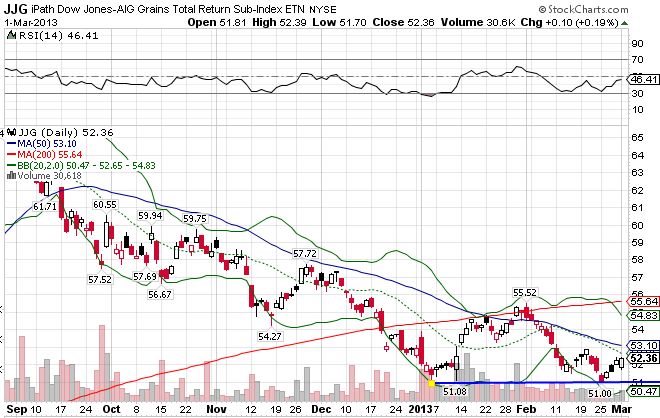
The DJ-AIG Grains Total Return Index ((JJG)) consists of Corn, Wheat, and Soybeans. The index was a spectacular performer in 2012 even after its correction at the end of the year, and it appears as if the bleeding has subsided and a bottom is forming. The index is down 1.08% so far in 2013.
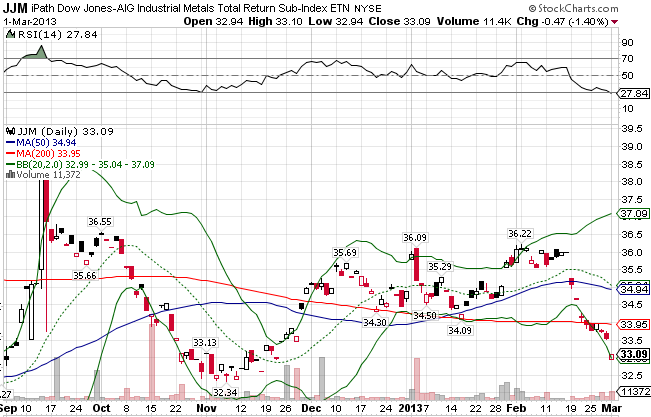
The DJ- AIG Industrial Metals Total return Index ((JJM)) includes Aluminum, Copper, Nickel, and Zinc. After spiking in September, the index quickly broke down and has remained in a state of flux since. It currently resides below both MAs, as most of the commodity indices do. JJM has been the one of the hardest hit by the strengthening dollar, down 5.10% YTD.
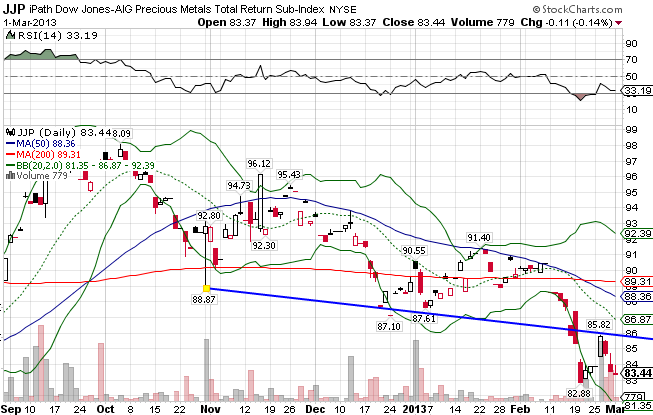
The DJ-AIG Precious Metals Index ((JJP)) includes Gold and Silver. The index is underperforming the whole commodity space, down 6.49% in just a little over two months.
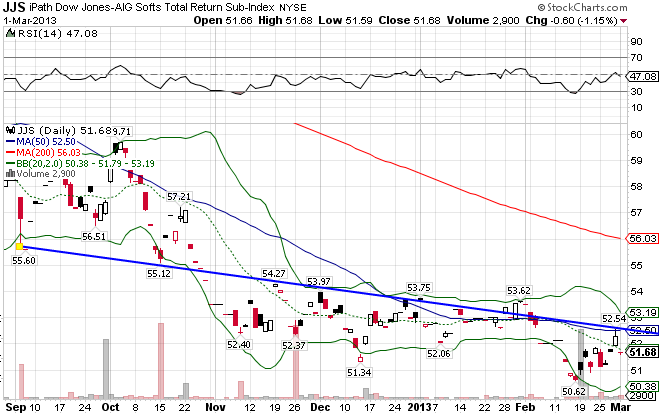
The DJ-AIG Softs Index ((JJS)) includes Coffee, Cotton, and Sugar. JJS is very weak technically, and has been for some time. It finds itself below the 50 and 200-day MAs and mired in an ugly downtrend. The index is down 2.49% YTD.
Stay In Touch