
Gold has not behaved like money in decades, rather gold is, for the most of the world, an investment class. We may not like such a development (it is one of the most insidious actions intentionally undertaken by central banks, including Basel rules) but gold is a liability on a bank’s balance sheet complete with a greater-than-zero risk-weighting. That means for banks gold is no different than, say, “high quality” mortgage bonds.
However, despite this diminished status, gold holds a property in banking that makes it especially valuable (pun intended) – it is universal. It crosses national boundaries easily. In the modern financial world of short-term liabilities and wholesale money, this universality can come in handy. A US$ mortgage bond can obtain a bank wholesale repo funding only in US$’s, but gold can obtain “repo” funding in any currency trading.
That means in times of extreme stress, gold acts like a universal liquidity stopgap – when all else fails, repo gold. The operational reality of a gold repo is a gold lease, charged at the forward rate (GOFO). In terms of market mechanics, a dramatic increase in gold leasing is seen as a massive increase in supply on the paper markets.
For various reasons in the past five years, collateral chains and the available collateral pool has dwindled dramatically. That has left banks to scramble for operational bypasses, but it also has led to periods of very acute stress.
When we match the price of gold against these stressed periods, they coincide perfectly. In other words, whenever collateralized lending has become problematic banks appeal to the universal collateral. Unfortunately, that looks like gold selling to the uninitiated.
These large declines in gold prices match date for date the extreme developments in the banking system across several currencies. And in each case the gold selloff has previewed a larger decline in systemic liquidity that eventually catches other asset classes.
This does not change the appeal of gold on the demand side – in these stressed periods there are defined trends of safety buying. The volatility in gold prices in 2008 shows this counterintuitive dichotomy very well.
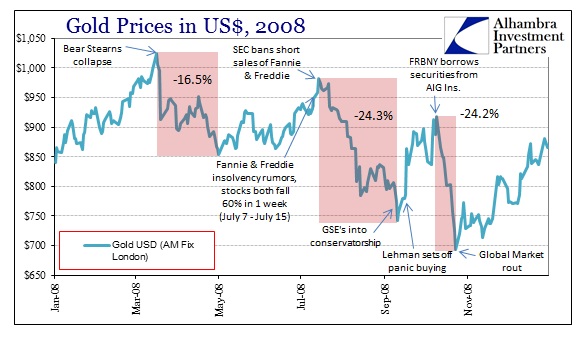
Physical prices in London hit an all-time high of $1,023.50 on March 17, 2008. That happened to be the Monday morning after Bear Stearns “failed”. From that point until May 2, gold prices dropped more than 16%. Banks had become keenly aware of counterparties and collateral, particularly with daily rumors of monoline insurers heading for bankruptcy filings. But ultimately, the price of gold stopped falling on May 2, 2008, which happened to be the very same day the FOMC expanded the list of eligible collateral in its TSLF Schedule 2 to include private label MBS and asset-backed paper. The Fed also increased the ceiling on its dollar swaps with the ECB (to $20 billion) and to the SNB (to $6 billion).
In other words, the entire 16% correction in gold prices resided exactly in the time between the fall of Bear Stearns and the Fed’s eventual reduction in collateral restrictions. This is not coincidence here.
By early July 2008, mortgage stress had begun to strain the main MBS GSE’s, Fannie and Freddie. Not only did these two quasi-government entities package mortgages into the private markets, their liabilities formed one of the primary backbones of the entire repo market. Agency debt at that time was the second largest source of US$ repo collateral in the multi-trillion repo markets across the globe. As liabilities, these assets in a repo are extremely sensitive to factors like insolvency and government takeover.
From July 8 through July 15, 2008, the stocks of both Fannie and Freddie collapsed 60% each. Treasury Secretary Paulson initiated a prior-approved (so he claimed) backstop of the GSE’s through the Federal Reserve, including a line of credit and a right of the US Treasury to purchase equity. On July 15, 2008, the SEC instituted a short sale “restriction” in both GSE’s.
Gold topped its intervening run at $981.75 ($986.00 in the PM fix) on July 15, 2008. From there it fell an astounding 24% as the collateral chain disrupted by agency repo counterparty fears (especially from foreign banks) led to another appeal to universal collateral.
The drop in gold continued on through Fannie and Freddie’s eventual demise into conservatorship on September 5, 2008. It was not until September 11 that gold prices would bottom.
That week Lehman rumors (as well as those of other financial firms including AIG and Wachovia) dominated. Gold prices abruptly reversed course, as demand for the metal due to growing panic pushed prices into a spike. On Friday, September 12, 2008, the Friday before the Lehman weekend, gold closed at $750.25. By the next Thursday, through Lehman’s bankruptcy and the rest, gold was up to $863, an amazing 15% rise in just four trading days. Gold exhibited its safety appeal on the demand side.
The run continued until October 10, 2012, the last day of the market panic. Prices had risen all the way to $918 an ounce, moving dramatically opposite the rest of the world’s “risk” assets.
As markets seemingly stabilized, the credit/repo crisis on the supply side took over and gold prices dropped like a stone, all the way to $692.50 on October 24, 2008; another 24% “correction”. However, markets were roiled again, as overseas stocks were pummeled on October 24: Nikkei -9.6%, London -7%, Paris -8%, Frankfurt -8%, Moscow -14%, etc. The NYSE was even forced to dispel rumors the US markets would not open on time. Not coincidentally gold prices began to reverse yet again as paper money sought hard money – from October 24 through December 29, 2008, gold rose 27%!
Again, these moves were not coincidence and each time gold prices were routed it related directly to collateral problems in the banking system – universality of gold as collateral acted as an anchor on general gold prices in all currencies.
The process was eventually repeated the very next time interbank stress heightened, in 2011.
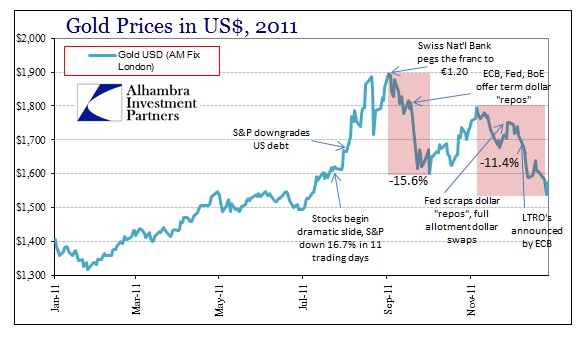
The scale of the volatility was less, but the pattern was unmistakable. Starting with the fears over the US debt downgrade, gold prices rose counter to the dramatic selloff in global stocks in late July/early August 2011. In Europe, the sovereign debt crisis had come to a head, so much so that the world’s central banks were forced into action.
The actions of the Swiss National Bank (pegging to the euro) and the Federal Reserve (offering a quasi-dollar swap through allotment auctions) demonstrated that once again banks were navigating a debilitating funding environment. Gold prices fell, as expected, by about 16%, only to rebound and fall again as funding realities ebbed and changed.
In every case where a dramatic selloff in gold has been seen across currencies, the hard collapse has been coincidental to collateral issues in the global system. In 2011, US$ repo funding was made more difficult by QE (more on this below). There was a reason European chaos led directly to the US central bank acting in US dollar liquidity arrangements.
These volatile movements in gold prices do not conform to traditional ideas about what makes gold prices move. Conventional wisdom posits, all too simplistically, that gold prices correlate exclusively with inflation expectations and real interest rates. What has been proven otherwise, without ambiguity, is that this is at best an incomplete explanation. Given the manner in which the banking system dominates asset markets and currency markets, the often more extreme motivations from financial firms should be given a more prominent place, particularly since these very factors match prices in exact chronology. This is entirely a product of global liquidity and the true interbank currency pool (collateral availability).
While central banks and politicians have proclaimed the Great Crisis as a relic of the past, there is an element to all this “liquidity” coming from central banks that acts in a counterproductive fashion. We saw this with QE 2, and the Federal Reserve itself has studied liquidity under these large scale asset purchases (such as QE) and determined that QE’s actually disrupt collateral chains. The bigger the QE, the less liquid the financial system grows because QE essentially removes usable collateral from the aggregate collateral pool.
The Bank of Japan and the Federal Reserve have been embarking upon the largest combined QE ever conceived – there has to be a drain on effective collateral liquidity at some point. We saw an atypical shortage of the 10-year UST for repo just last month. It is very possible, in my opinion likely, that QE is again wreaking havoc on collateral systems across the globe. If that is the case, then the collapse in gold prices both indicates this illiquid stance and portends something worse developing down the road.
Recent history has been very clear about the role of gold and interbank financing. There is no reason to think this time is different. Some observers might be inclined to see Goldilocks – the Fed’s crowning and crowing achievement of low interest rates/steady growth, but would that likely result in a collapse in gold prices? It seems a far more plausible explanation, given that this has transpired five times in the past five years, that bank liquidity explains gold rather than a new prosperous age of investor content surrounding central banks.
After all, does it not seem the least bit odd that every major central bank (and some minors) on the planet is debasing at the same time yet gold prices in most currencies have seemingly been “ignoring” this development? It is far more likely that investors have not been ignoring debasement, as physical gold inventory has been declining precipitously since the beginning of the year, and that “supply” due to collateral problems has been driving gold prices. Like most things, this time isn’t different.
Stay In Touch