
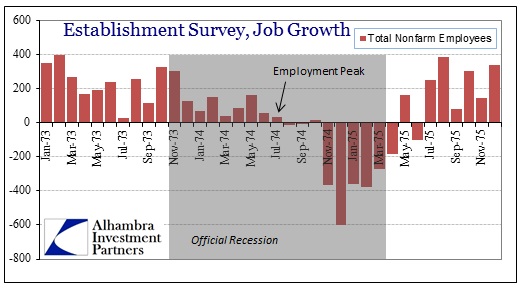
The headline employment growth for May 1974 totaled 165,000 jobs. That followed a weaker report from April where only 89,000 new jobs were created. Only a few months before, the headline beancount of job quantity was 304,000. For the seven months between November 1973 and May 1974, the headline averaged +135,000.
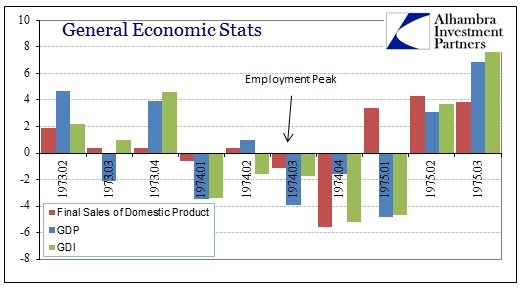
That was notable because the entire period fell within the official recession dates as provided by the NBER. According to other measures of economic activity, including GDP and spending data, the US was already well within an economic contraction. Yet the total count of employment continued to expand for nine months into what was a long and eventually sharp economic drop.
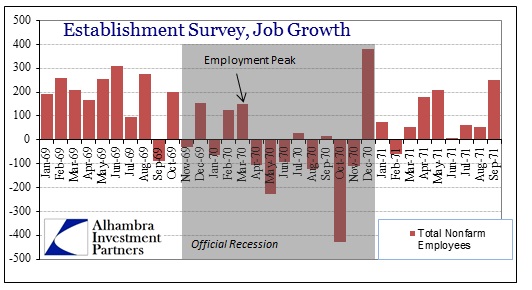
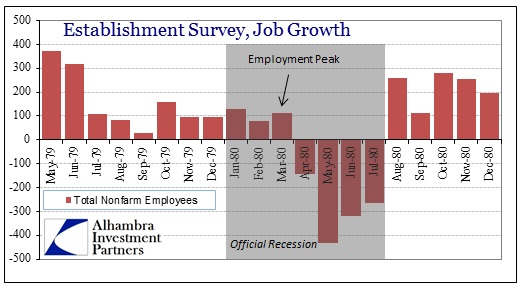
The 1974-75 recession was not the only example of this employment lag. The recessions preceding and following demonstrated the same pattern.
All three contractions took place during the Great Inflation, a period characterized not just by consumer inflation but rapidly expanding money and credit. Monetary imbalances are not monolithic despite mainstream economists’ treatment of them as such. These large imbalances (consumer inflation is only one symptom of many) can and do have drastically different effects across different segments of the economic system. Given this broad range of responses, you would expect that some economic sectors can actually benefit from monetary imbalances, or at least show growth, while other segments are sinking.
This leads to an economic system that appears to be both working and not working simultaneously, a notable bifurcation. It is here that current mainstream thought and policy resides – economists hope that the “positive” force of inflation-driven activity pulls up the rest of the malfunctioning system. Historical fact, however, shows the opposite. The malfunctioning segments actually bring down the whole as monetary imbalances are not stable enough to overcome themselves.
It is little wonder, then, that the current economic landscape appears to share striking similarities with the recessions of the 1970’s. Most observers are not able to get past the element of consumer inflation as the only feature of monetary imbalance, but inflation takes on many forms. What is consistent in this bifurcation is the narrow range to which “positive” economic inertia applies – only a small piece of the economic system benefits from asset inflation. Monetary imbalances produce economic fragmentation through whatever current means are evident in that time period.
The current age is one where asset inflation benefits wealthy investors and large multi-national corporations (through liquidity and dollar debasement) disproportionately. The remaining segments of the economic system fall further and further behind. The intent, the appeal to policymakers, is that the “good” segments pull up the “bad” so that the overall system heals and moves forward. Stock prices, for example, should induce a wealth effect but it never quite works that way.
The main problem, in terms of jobs and employment, has been the focus on the numerical count of total jobs. But that misses the essence of the ongoing monetary imbalance.
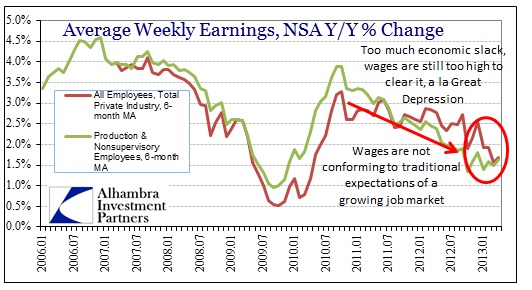
If employment growth driven by monetary imbalance was “working”, it would lead to less labor slack. Wage growth, however, has fallen steadily since the middle of 2010 (QE 2?) indicating that labor resources are not being fully utilized. That either means a price adjustment is in process (in that wage rates are still too high to clear the slack, which does not conform to profit expansion) or that slack is a structural problem (previous monetary imbalance).
According to the Household Survey, 1.7 million jobs were created in the twelve months ended April 2013. Over the same period, the civilian non-institutional population (potential labor force) grew by 2.4 million people. The official labor force, however, only grew by 873,000. So while there appears to be a 841,000 surplus of jobs to absorb the unemployed still left from the Great Recession, it leaves out 1.6 million potential labor supply entirely.
This is the primary evidence for the bifurcated economy, but it is not the only evidence. The composition of job growth is also provides a clue.
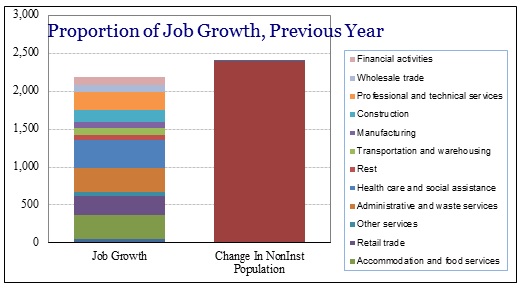
From the Establishment Survey, we see that almost a third of job growth has come from the lowest wage segments – arts & entertainment, food service, “other” and administrative services (including temps). In fact, nearly all the job growth in the past year (in the entire recovery) has been from the personal services segment concentrated at the lowest end (the quality of jobs vs. quantity). That is something you would expect to see where the segments of the economy most exposed to the “benefits” of monetary imbalance are doing quite well, while the rest are left completely unprotected against the nefarious aspects of inflation.
Even in the personal services segment, however, there are inconsistencies with other economic data points. We know from various data series that goods manufacturing and activity is, at best, weak, and in other areas contracting outright. The BLS shows only a modest decline in manufacturing employment, but a large positive contribution from retail trade employment. While this falls under the services segment, it is largely related to manufacturing and the trade of durable and nondurable goods.
Retail sales have been at recessionary levels, having just experienced the worst two-month period of the entire recovery period, yet the BLS is estimating an increase of 29,000 jobs in April. This inconsistency is most stark in general merchandise stores.
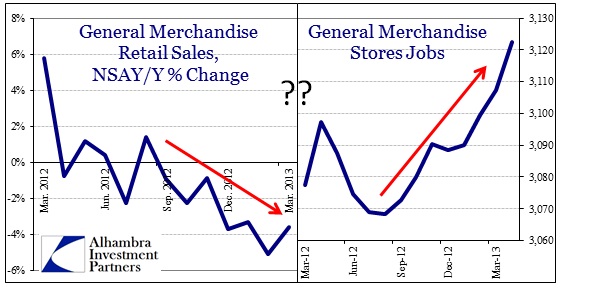
Since August 2012, the BLS estimates steadily growing employment while from the exact same inflection month the Census Bureau shows a large and growing decline in actual sales. This is another example of conflicting data where only one can be right.
Again, I think this relates to the inconsistency of the wider economic dysfunction. Monetary imbalances are difficult to measure (including consumer inflation) and the impacts are not well-defined in the current framework of economic accounts. After all, the accounting across all of these various data collecting agencies is skewed to favor “dollar growth” as a measure of success, rather than wealth distribution and efficient circulation. It is the latter that is lacking, similar to those inflationary recessions from decades ago.
Stay In Touch