
With today’s slight downward revision to Q1 ’13 GDP, apologies to Eric Rosengren, comes the preliminary estimate of corporate profits. Corporate earnings estimated here by the BEA are sometimes quite different from those estimated by Standard & Poors, for example. One major difference is the S&P focus on earnings per share, where the BEA is only interested in pure income.
In the first quarter of this year, profits from current production fell $43.8 billion from Q4 ’12. Corporate profits before tax are likewise lower, by $16.7 billion, but are up $267 billion since Q4 ’11.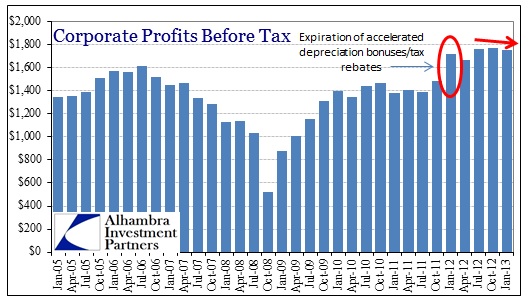
However, with tax rebates and incentives that expired in Q4 ’11, the data is not fully comparable. Since companies were depreciating capital expenditures at an accelerated rate during the period, these tax incentives decreased “taxable” income below where it would have been otherwise. Now that they have expired, net income features less depreciation, making comparisons on this basis difficult.
Instead, the BEA makes adjustments to net income called the capital consumption adjustment (CCadj) and inventory valuation adjustment (IVA). These strip out accrual accounting measures for both the taxable effect of including depreciation and the cost vs. market value of inventory. This measure, profits from current production, shows much less growth since the beginning of 2011.
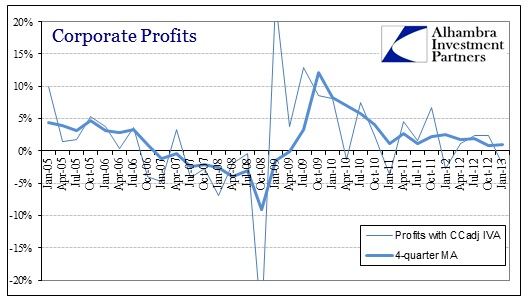
This certainly diverges with the measure of profits by S&P, particularly 2011. In fact, given weak economic activity that really began in early 2012, a lower profit growth the preceding year makes much more sense. So where record profit growth estimates buoyed stock investors and stock prices into 2012, they were not really confirmed by other contemporary measures.
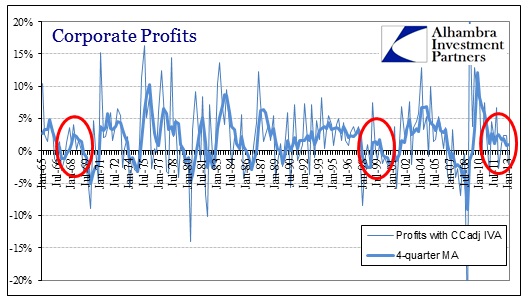
On a historical basis, current and persistent low levels of profit growth have only been seen on two previous occasions, both of which were intervening periods between a near-recession and full recession.
What differs between these historical periods is the fraction corporate businesses actually derived from domestic production. Included in these measures of corporate profitability are both financial firms and profits derived from overseas activities. Both of these “sectors” have increased in importance dramatically since the late 1960’s/early 1970’s. The timing of the proportional change, as it relates to financial firms, makes sense given the incessant increase in money flowing as inflation of all forms.
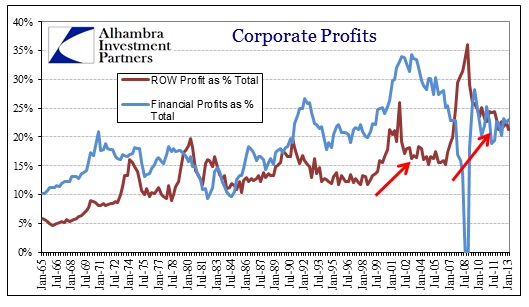
Beginning in 1998, however, the rise in proportion of profits from overseas is significant. From an average of about 12% in the early to mid 1990’s, overseas profits have been growing particularly after each of the two recessions of the 21st century. That suggests, given the monetary activity that accompanied them, that the weaker dollar has played a role in corporate decision-making.
Given these proportions of financial and ROW profits, the share of domestic non-financial production profits to total economic activity as measured by GNP* has dropped dramatically since the outset of the Great Inflation. By this measure, the various outlets of monetarism in the economy that have taken root since the 1960’s, are clearer.
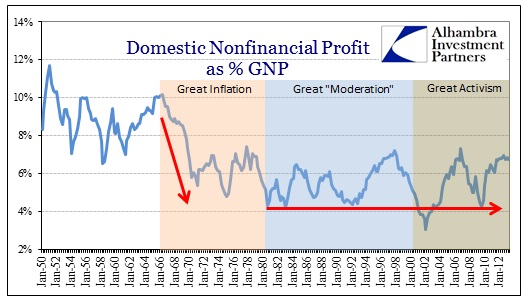
While profit growth has returned since the Great Recession, it is clearly slowing and is not really out of line with the pre-2008 levels established during these monetarist periods. This offers one explanation, particularly after 1998, for the inability of wages to grow at previous levels. Outside of finance, businesses are still and increasingly devoting their resources where the most marginal profits have been derived – overseas.
Given, then, the over-proportion of finance and ROW in the profit series, slowing net income growth across all sectors is even less welcome for the domestic economy. That is certainly one feature that is consistent between the BEA and S&P.
*I made the comparison to GNP rather than GDP due to the slight difference in definition. GDP is a measure of domestic expenditure or output of a particular country, where GNP includes output of domestic citizens regardless of the country the output was achieved. In other words, GNP includes income from abroad, including dividends, interest and profits (netted).
A US manufacturer that produces products in a foreign country will not be included in US GDP, but will be included in that foreign country’s GDP. However, if and when that manufacturer repatriates profits, it will count against the foreign country’s GNP (since that country will not benefit from earned profits heading to the US) but count for US GNP.
In the context of this discussion, GNP is more appropriate as a measure of US activity outside the US. Given what we know of corporate reluctance to repatriate, thanks in part to Apple’s recent financial moves, GNP is likely understated. That then, underestimates the degree to which domestic manufacturers are favoring marginal investment and production overseas.
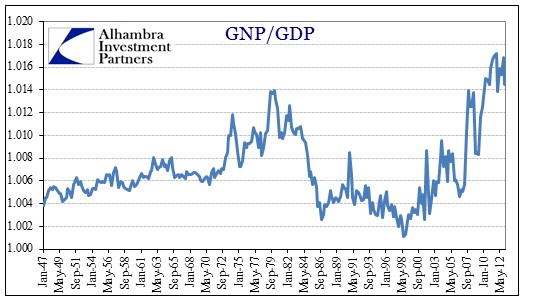
Comparing GNP to GDP for the US, the degree to which GNP has outgrown GDP is rather small, but, again if it is understated, then it may not at all be unimportant. And the timing of the moves confirms largely what the data above has been saying about the marginal preferences of corporate businesses with regard to actual (as opposed to financial) investments.
Click here to sign up for our free weekly e-newsletter.
“Wealth preservation and accumulation through thoughtful investing.”
For information on Alhambra Investment Partners’ money management services and global portfolio approach to capital preservation, contact us at: jhudak@4kb.d43.myftpupload.com
Stay In Touch