
It is nearly impossible to spot recession and economic weakness in real time through economic accounts alone. Because of the way economic estimates are gathered and, more importantly, calculated, they will always be “behind the curve” of economic trends as they shift from one state to the next. In other words, the Bureau of Economic Analysis, much like the NBER, will be the last to know about a recession.
The primary case in point is the Great Recession itself. Going by concurrent estimations of GDP growth rates, the BEA did not see any actual contraction until October 2008.
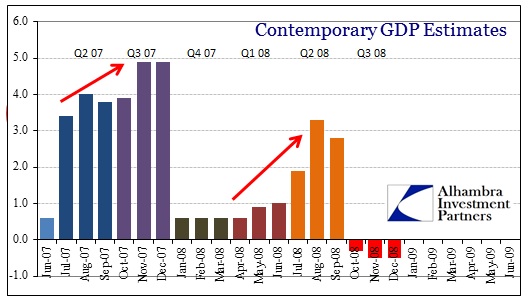
Because of the way GDP approximations are released to the public (advance, preliminary, then final), there is a monthly running record of estimated economic growth. Again, none of the estimates for GDP were negative until the advance estimate for Q3 ’08, which was then only slightly negative. By then, it did not matter since panic had already gripped liquidity and asset markets all over the world.
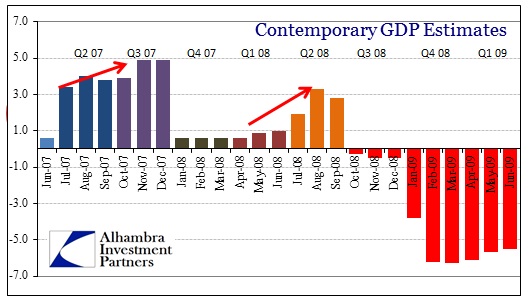
Up until that panic, however, it appeared as if the economy was accelerating its way out of any potential recession. That summer, according to the BEA, economic growth looked very promising. It wasn’t until 2009 that there was no mistaking what had already occurred. Before that, it was, in no small part because of these mistaken calibrations, somewhat plausible that the economy might “decouple” from the brewing financial peril.
Since that time, the BEA has re-examined and re-evaluated its data and statistical calculations, particularly as it relates to trend-cycle analysis and theory, and has new post hoc estimates of how bad 2008 actually was.
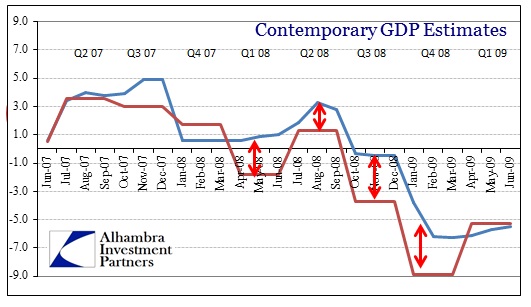
The picture of the Great Recession changes entirely in the wake of the benchmark revisions process. But even this comparison fails to capture just how bad concurrent analysis really was.
For the first three quarters of 2008, initial indications, even “final” estimates, were off by a wide margin. Judging them by these new estimates, the BEA gave a completely different and erroneous picture of the US economy heading into the panic period.
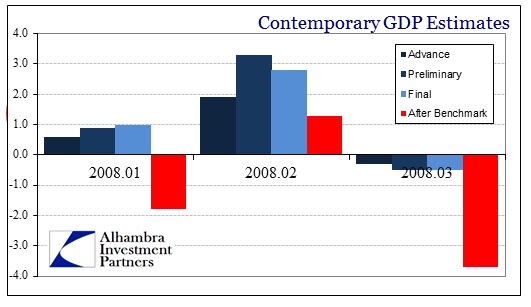
Where they saw nearly 1% growth in Q1, they not only got the sign wrong, it was actually the worst quarter of any in the prior two decades – worse than all in the 2001 recession. In fact, the last time the US economy had experience of -1.8% or worse was in Q4 1991. That’s not just an error, it is fully misleading.
The hope inspired by Q2 ’08, while not fully revised away, looks much different at 1.3% than 3.3% (preliminary estimate), particularly since so much of conventional analysis considers +2% growth above “stall speed”. For the Bush administration’s ridiculous fiscal “stimulus” (remember the $300 or $600 “rebate”) it actually looked as if it might be helping. As did bias toward monetary stimulus and Chairman Bernanke’s predictive abilities [June 2008, “The risk that the economy has entered a substantial downturn appears to have diminished over the past month or so.”]
Lastly, once summer waned and panic had fully dug into the various markets, the BEA was still only showing a small and minor contraction for Q3 ’08. What was estimated in the “advance” release in October 2008 at -0.3% has now been re-calculated at -3.7%; an order of magnitude beyond in scale of contraction. Q3 ’08 was the worst quarter for GDP growth (to that point) since Q1 1982. None of this severity was conveyed by economic accounts at the time; indeed, to many, including the economists sitting in voting positions at the FOMC, the opposite, slow-growth path seemed to have been confirmed.
The contemporary estimates of GDP simply do not make sense in light of what came next. While initially missing with the advance estimate for Q4 ’08 in January 2009 at -3.8%, by the next month the BEA would finally grasp reality outside its economic accounts; -6.2% which is now figured at a near-catastrophic -8.9%.
What looked like slow growth to the X-12-ARIMA calculations at the BEA was something drastically worse – a great dichotomy between official figures and the trends that had developed in other indications, including finance and liquidity. Worse, these figures were incorporated across the spectrum, from investor expectations (market rallies in early summer 2008) to the “worst is behind us” proclamations from every policymaker and economist within the vicinity of a microphone. The BEA gave that sentiment an “empirical” foundation, hardening the rampant recency bias.
If you want to find recession, the last place you should look is GDP.
Click here to sign up for our free weekly e-newsletter.
“Wealth preservation and accumulation through thoughtful investing.”
For information on Alhambra Investment Partners’ money management services and global portfolio approach to capital preservation, contact us at: jhudak@4kb.d43.myftpupload.com
Stay In Touch