
There still hasn’t been any official acknowledgement that QE damages effective liquidity by removing usable collateral from the system. By purchasing US Treasury debt securities, including those just auctioned, the Federal Reserve is reducing what is left for the market to repo and, more importantly for fragmented markets, rehypothecate. The closest we have to facing up to the problem is the academic side of the Fed writing papers about it.
However, if we look at what the Open Market Desk has been doing in its SOMA purchasing (the operational arm of QE), it becomes clear that something has changed since March 2013. QE 4, the UST part of the new balance sheet initiative, as opposed to QE 3 which deals in MBS, isn’t really that old, but this short history of activity in SOMA is quite revealing, in my opinion.
First, we start with the premise that repo counterparties prefer, by and large, on-the-run (OTR) treasuries – the securities most recently auctioned. There is a tremendous liquidity difference between OTR and off-the-run (OFR), and since repo counterparties need to be assured they can quickly sell collateral at reasonable pricing should the cash borrower default, OTR’s provide the most liquid section of the treasury repo marketplace.
That’s not to say that repo dealers and counterparties do not use OFR securities for repo, but the difference is about 90%; that is, once an OTR security is replaced by the next auction, volume of trading in that now-OFR drops by an estimated 90% and making it far less liquid and desirable.
QE’s buildup of UST bonds and notes, after Operation Twist, has continued where only traditionally short-dated debt existed in the SOMA portfolio before. Below is the 2013 list of OTR securities and the QE purchasing activity in them (I have omitted the 2-year and 3-year since the Open Market Desk has avoided them to date).
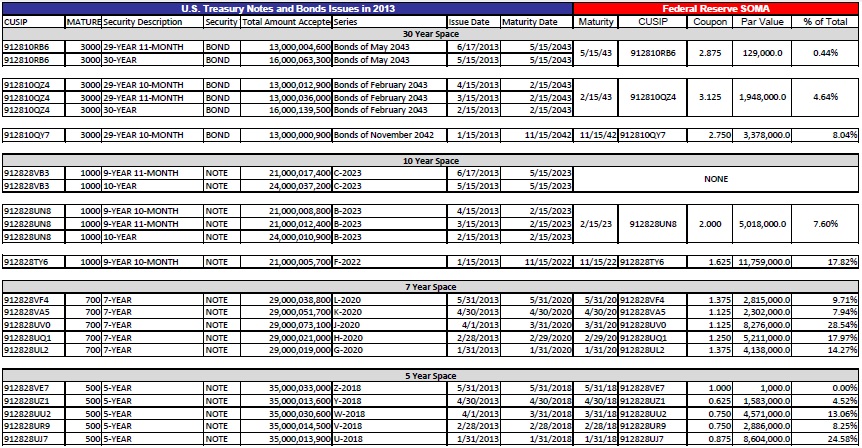
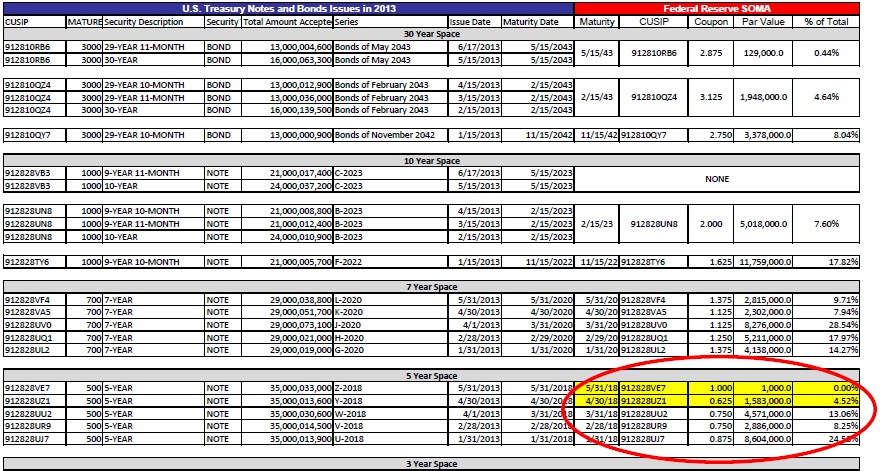
Starting with the 5-year, the Fed initially bought up almost 25% of the OTR from the January 31, 2013, auction. In March, it was about 13%, and then dropping to less than 5%; and then none.
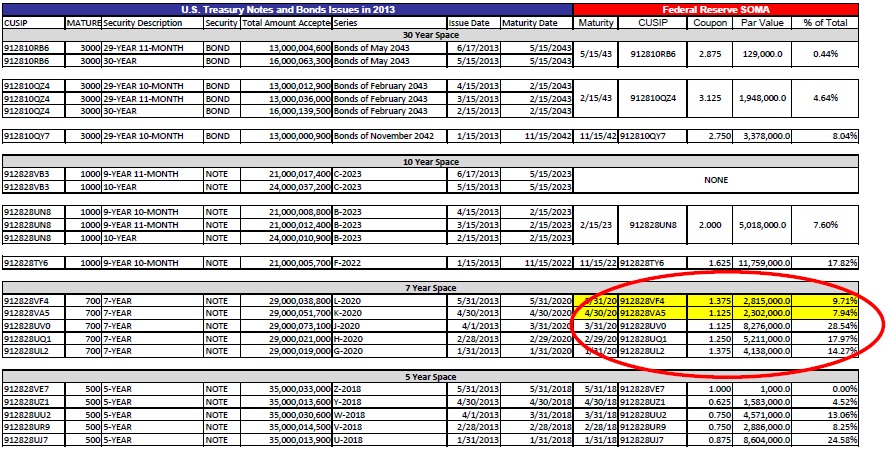
In the 7-year issue, an important benchmark security, a very similar pattern emerges. The January auction saw more than 14% go to SOMA; then 18%; then a rather large 28.5%. After the March auction, a dramatic decline in SOMA activity, back down to the single digits.
Next, in the all-important 10-year OTR’s: almost 18% at the January auction, then some cloudy information in the triple issue that began in March 2013 which only saw 7.6% of the total, including the 2 re-openings. After the March triple issue, the May triple issue has seen zero SOMA/QE activity.

It was right at March 15 when the first 10-year repo special caught attention. There have been other repo warnings in the months since, which is particularly odd since the 10-year has been in the double-reopening format (triple issue).
Since the UST has been running such large deficits post-2008, the auction schedule has been amended to more frequent auctions of debt by necessity, including 10-year bonds through this triple issue framework. That means that in the OTR of the 10-year UST, there are 3 months’ worth of bonds in a single OTR CUSIP.
Shortages of 10-year UST for repo collateral can be reasonably understood in the first go-around of the triple issue cycle. Thus, the repo special before the February 2013 switch isn’t necessarily out of line or concerning – the repo market condensed 3-months of a triple issue OTR into one-month of the next OTR.
However, a special rate for the 10-year crossing the entire triple issue is particularly noteworthy. That is what we have seen in the months since that first special, going on two consecutive triple issue cycles. For some reason, collateral continues to be short of demand in repo markets and the re-openings have not fully satisfied them.
What the SOMA data above suggests, and highly so, is that the Fed recognizes the role of QE in removing OTR collateral. Why else would they start by purchasing relatively high proportions of OTR’s and then drop to nothing, or nearly nothing, after the repo markets went so special? It seems pretty clear to me that the Fed noticed the repo warnings and acted, thus confirming, operationally, what we have suspected about QE.
Since then, the Fed has remained out of the OTR space almost entirely. But that might not fully help either since there is a growing proportion of OFR in the SOMA portfolio. While the Fed can and does “rent” out SOMA collateral, it adds another layer of cost and complexity to repo markets that for some reason don’t want to follow the “normalcy” script. Therefore, it’s not a perfect solution to the shortage.
Bottom line is I believe collateralized lending markets, the marginal source of effective liquidity post-2007, are short of collateral for numerous reasons, leading to all manner of side-effects. I think this data confirms that the Federal Reserve agrees, including the role QE may be playing.
Click here to sign up for our free weekly e-newsletter.
“Wealth preservation and accumulation through thoughtful investing.”
For information on Alhambra Investment Partners’ money management services and global portfolio approach to capital preservation, contact us at: jhudak@4kb.d43.myftpupload.com
Stay In Touch