
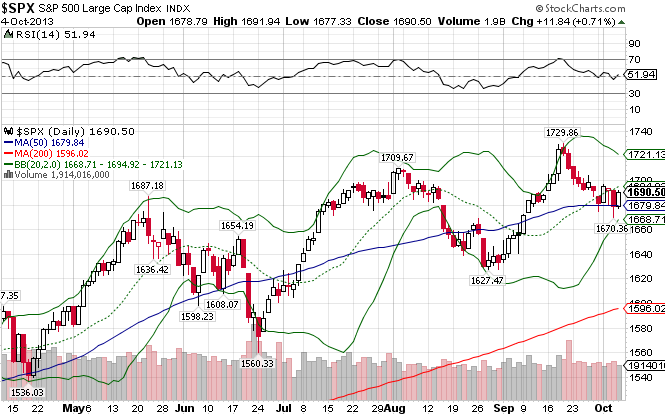
The Standard & Poor’s 500 ((IVV)) had been on a tear since blasting through resistance at the 50-day moving average in the beginning of July. But after hitting a new all-time high above the 1730 level in mid September, it has come back down to Earth, falling below the 50-day moving average before bouncing back some this past week. In order to continue its run to new highs, it must close above the 1700 level, which looks unlikely given the climate in Washington and the ever present government shutdown. The index is up 20.37% year-to-date.
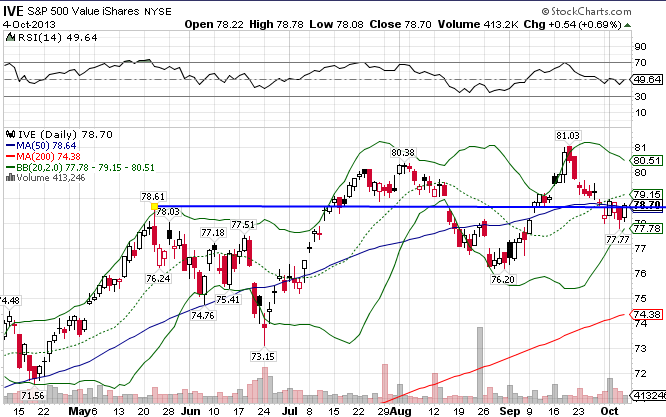
The S&P 500 Value Index ((IVE)), which consists primarily of US large-cap value stocks in the financial services, industrial, and consumer cyclical industries, tend to have lower price to earnings ratios and higher dividend yields than the market as a whole. This index took a hard hit since it hit all-time highs, and now looks to be in worse shape than the overall market as it closed below its 50-day. Compared to the S&P 500, the index is still outperforming but by the slightest of margins, returning 20.50% for all of 2013.
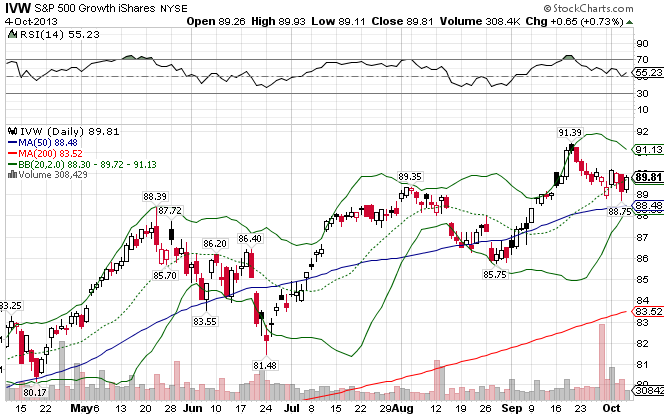
The S&P 500 Growth Index ((IVW)), which consists primarily of US large-cap growth stocks in the tech, healthcare, and energy industries, tend to have higher earnings growth rates, higher earnings multiples, and little or no dividend yields. The index is slightly behind pace set by its value counterpart, but has the better-looking technicals, as it still sits above support at the 50-day. Since the start of the new year, the index is up 19.99%, less than the overall market.
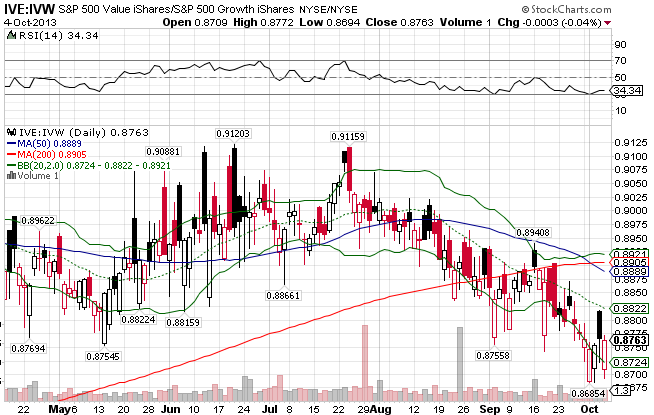
In the past few months, a short-term trend of growth stocks outperforming value stocks has emerged. The trend is strengthening of late.
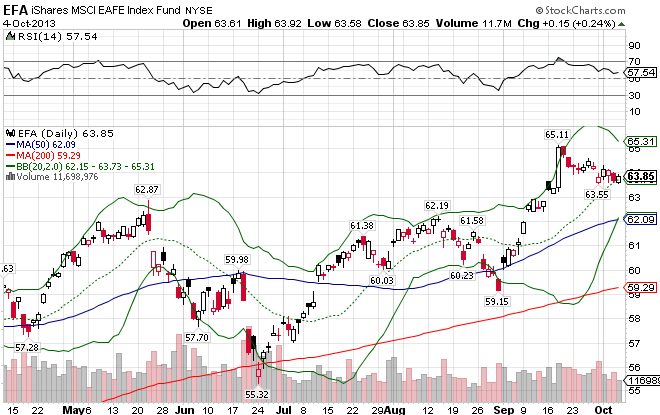
The MSCI EAFE Index ((EFA)), a global developed market index that encompasses Europe, Australasia, and the Far East, has held up much better than the its US equivalent in the most recent market shakeup in September. Are things finally turning around in the developed world ex-US? As negative chatter surrounding Japan and Europe subsides, the index has concurrently built a base and developed a picture-perfect uptrend line. EFA now sits comfortably above both moving averages and has weathered this new downturn with relative ease and minimal damage…so far. The index is up 14.55% YTD.
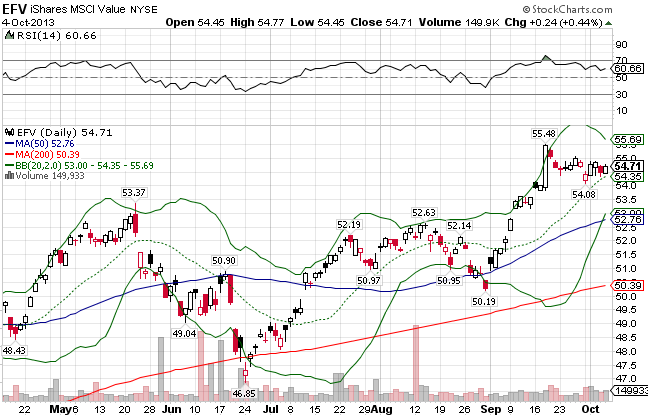
The MSCI EAFE Value Index ((EFV)), which consists primarily of low P/E international large-cap value stocks in the financials, energy, and communications industries, broke out to the upside in the last month, and has managed to hold the gains to this point. Unlike the US markets, international value stocks are outperforming growth stocks of late, and the trend seems to be strengthening. The index is up 15.05% for all of 2013.
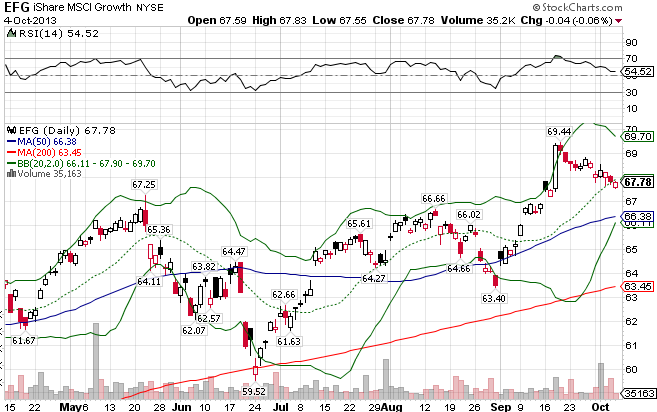
The MSCI EAFE Growth Index ((EFG)), which consists primarily of high-growth international large-cap growth stocks in the industrial, healthcare, and consumer cyclical industries, has underperformed compared to the value index. The index is up 14.48% YTD.
Stay In Touch