
Market risk in whatever asset class is usually estimated by volatility, and conceptually thought out in that way. Higher volatility is typically associated with “riskier” markets, particularly stocks.
Let’s assume that you have two market choices for investment. The first features a standard deviation (1-year period of weekly market returns) of 1.48% where the VIX is 12.83. The second market includes a standard deviation of 6.76% and a VIX of 50. Optically, given the conventional thoughts on market risk, the first market appears to be the “safer” option.
However, as any contrarian will attest, these appearances are deceiving. What those measures really tell us, as they correspond to real historical experience, relates not to future volatility but contemporary complacency. The “low” volatility market was May 2007; the “high” volatility market was March 2009. Obviously, investing in the “high” volatility market would have been far more profitable.
Historically speaking, episodes of extremes in volatility usually mark market inflections.
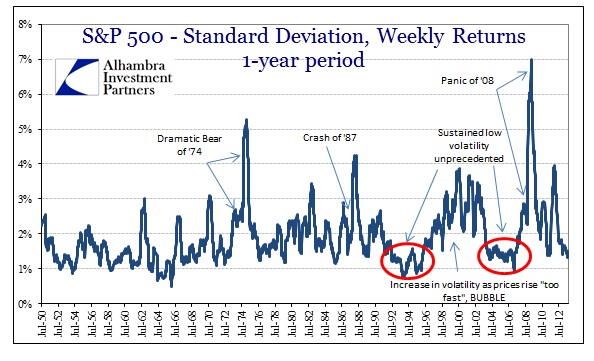
Before the activist Fed era, market volatility appeared very much like an EKG readout. Risk “flares” and their antecedents appeared in discrete periods, coming and going with an almost tidy balance over time. That changed in the latter half of the 1980’s, particularly entering the 1990’s. It is another data point that appears to show a structural market change after the Crash of ’87 (the Greenspan Fed).
That was the conversion point of monetary policy as it moved fully to interest rate targeting, thus promising an endless source of fungible “reserves” for wholesale money markets at whatever target set by the FOMC. In the two periods I marked above, it is clear that there is no historical precedence for such a sustained extreme of low volatility.
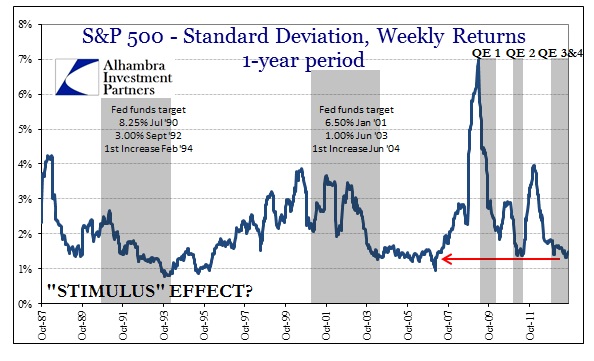
Both these outcomes corresponded with historically extreme “stimulus” measures of monetary interest rate targeting. In the early 1990’s, the Fed lowered its fed funds target more than 500bps, and kept that then-historically low target for two full years. That was itself unprecedented (to that point).
Market volatility rose after 1995 not due to any “bear” episode, but rather as stocks became fully unhinged from historical precedence, or what we now refer to as the dot-com bubble. The inevitable bursting of that bubble led to another discrete period of atypical monetary appeal, this time as the fed funds target was lowered all the way to 1%. Despite a great deal of consternation about the effects of such a low target, it was maintained until 2004 (now known as the housing bubble).
Again, this heavy hand of stimulus corresponds to a sustained period of extremely low market volatility that screams “artificial.” It was a period of rapid, but steady, ascent in stock prices. It is something that we see in markets today, particularly whenever expectations for QE prove irresistible (and usually correct).
Were it not for the “flash crash” of 2010 and then the debt ceiling “bear” market of 2011, there is a good likelihood that this low volatility extreme would have been reached and sustained in the years since the 2008 panic. That the pattern of QE fits so well into these shorter duration incidents only adds to the suspicion that they are anything but “normal.”
The primary question to be asked of all this is whether or not it actually matters. In 2007, the extreme low of volatility occurred within a few months of a major inflection that left the market in tatters. However, the low volatility in the early to mid-1990’s kicked off a massive stock bubble that brought valuations to obscene levels.
There is a world of difference between the market valuations of 2013 and 1993, however, not to mention fundamental economic characteristics.
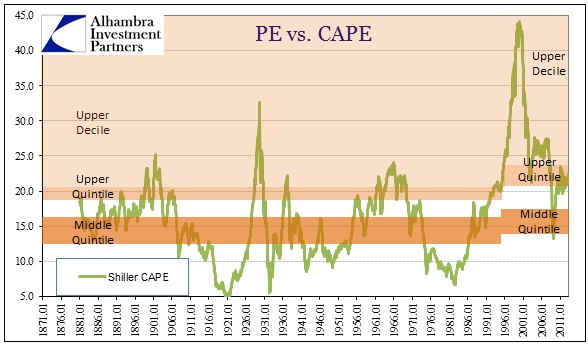
The market CAPE was in the middle quintile in the early 1990’s, where current valuations continue to push the upper quintile (and upper decile by pre-1995 calculations). In other words, there were decent long-term valuations amidst a productivity/innovation boom that lasted nearly a decade further. That it would lead to an historic stock bubble is simply evidence of the size of the ongoing monetary imbalance.
Again, in no way does the current fundamental backdrop compare favorably. There is no new innovation or productivity boom in place currently, particularly as most productivity has been derived in this millennia not from new technology adaption but from over-emphasis on company profits (cost cutting) and profits per share (financial investment). Add that to the high valuation starting point, and the complacency of 2013 appears highly irregular; except if we instead compare to the complacency in 2007.
It is with 2007 that the comparisons begin to align rather easily – slowing/reversing economy, asset prices having already risen in massive and steady moves, and the reversal of perceptions regarding monetary stance. We can also add market leverage as a glaring similarity.
Click here to sign up for our free weekly e-newsletter.
“Wealth preservation and accumulation through thoughtful investing.”
For information on Alhambra Investment Partners’ money management services and global portfolio approach to capital preservation, contact us at: jhudak@4kb.d43.myftpupload.com
Stay In Touch