
The biggest avowed critique of the current method of estimating changes in economic accounts is the inability of statistical techniques to anticipate trend changes, or inflections. This gets back to the basics of statistical analysis as it relates to “seasonal” adjustments that are really driven by “trend-cycle” analysis. Until the NBER declares a recession, or more specifically a “cyclical peak”, the various government agencies that track these economic accounts simply assume the previous trend is valid. Benchmarks are largely set by those assumptions, and the month-to-month variations are only estimating variance to the benchmark trend.
I think this cyclical problem is becoming more and more obvious in the employment reports. The divergence between the Establishment Survey and the Household Survey has been an ongoing theme, and the delayed September report is no different. There was no huge separation within the month of September, only a continuance of that trend.
The Establishment Survey, the “less volatile” and highly adjusted method, counted 148,000 new jobs in the month. The Household Survey showed 133,000.
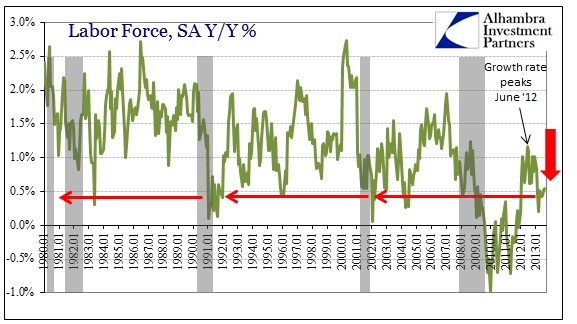
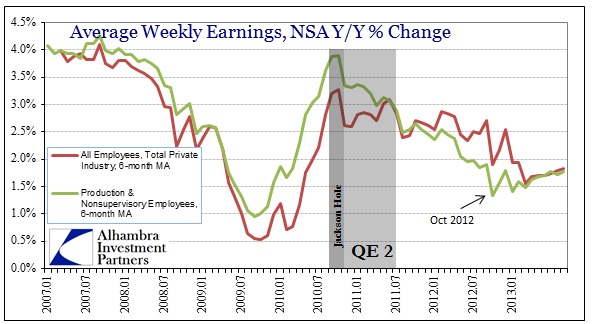
The labor force changes since the employment bottom in 2010 have been very telling. Peak growth, which would signal a transition in “cycles” never really materialized. More important, whatever labor growth that did occur peaked right in the middle part of 2012 – exactly when every other economic measure slowed significantly (chart above). The current expansion in the labor force looks much more like recession than even “muddle”-type growth.
The real problem continues to be the calculation and rules about who counts as “in the labor force” and who does not. As I mentioned after the August 2013 report, the BLS uses a 52-week limitation to screen out “discouraged workers.” Since so many of those that became unemployed during the Great Recession and aftermath “enjoyed” up to 99 weeks of benefits, their inability to transition from UI to employment is kept out of the Establishment Survey and the official unemployment rate altogether.
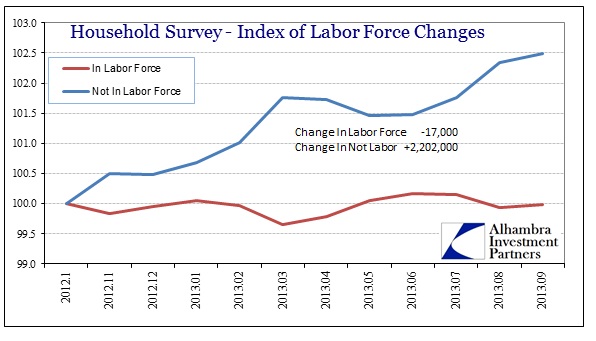
As a matter of simple mathematics, these unfortunate victims of the planned recovery are counted as a balancing item, those “not in labor force.” However, they may be influencing the Household Survey, at least enough to chart an obviously divergent course from the Establishment Survey.
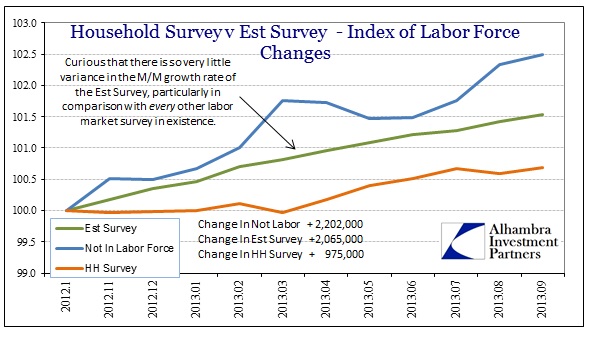
While the million-plus disagreement between the surveys is striking, perhaps the most significant aspect of this dichotomy may be that the Establishment Survey is essentially following a straight line path. Again, economists prefer it because of the lack of volatility, but this may not be what they had in mind.
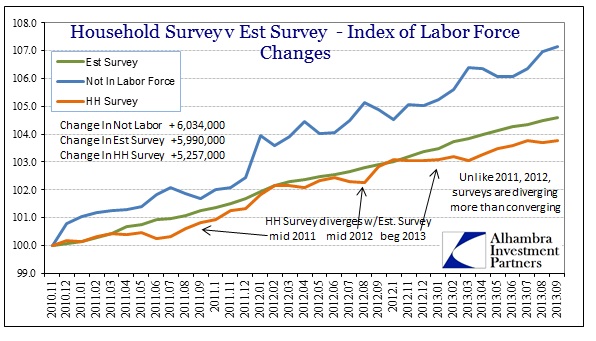
There was some “lumpiness” to the Establishment Survey in late 2011, but since mid-2012, it has been largely a straight line with only minute variations – as if it were following a pre-planned course (like a benchmark). The Household Survey, on the other hand, has undershot the straight course of the Establishment Survey on two previous occasions, only to converge in relatively short order. The third, beginning in that mid-2012 slowdown period, has failed to confirm the Establishment Survey’s benchmarked path. That might suggest something changed in the middle of 2012.
Given the academic framework for calculating “seasonal adjustments”, we might fairly suspect a trend cycle peak has been reached and has yet to be recognized in the Establishment Survey benchmark. This goes further than Chairman Bernanke’s assertion in July that the employment gains for 2013 are being overestimated, but economists are usually the last to know about inflections.
Finally, this slump in employment is keeping income growth at recessionary levels. Throw in even modest inflation and incomes are not growing at all (and workers are perceiving this as declining economic circumstances).
Everything about the data in 2013 is unusual or atypical. That itself should be enough to question the validity of any economic account that relies heavily on pre-2012 assumptions.
Click here to sign up for our free weekly e-newsletter.
“Wealth preservation and accumulation through thoughtful investing.”
For information on Alhambra Investment Partners’ money management services and global portfolio approach to capital preservation, contact us at: jhudak@4kb.d43.myftpupload.com
Stay In Touch