
Ever since the ISM Manufacturing Index jumped in July (after having fell below 50 in May), commentary has centered on the idea of this particular index being emblematic of the wider economy. It is largely common knowledge that a reading above 50 is supposed to denote “expansion” in manufacturing, but what does 56.4 tell us about the economy?
In short, it doesn’t tell us very much in isolation. Despite all the proclamations based solely on this one index (the recovery is here!), a little time spent looking at the historical record dispels any such certainty.
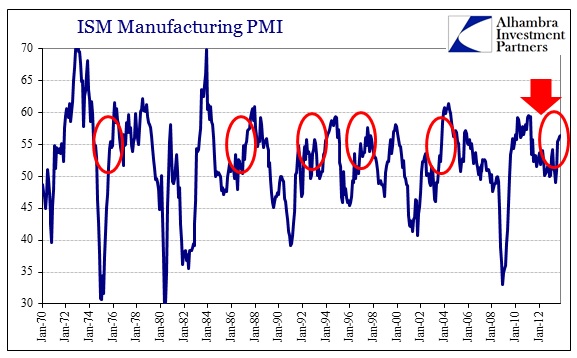
I have selected five previous months where the ISM Manufacturing Index was both close to the current monthly reading of 56.4 and the index itself was in an upward trend, as it is now.
Using those months as a basis of comparison, if the current mainstream interpretation is correct we should see relatively close results. Instead, we see the opposite – there is great variation of economic conditions, despite the fact the ISM index is the same.
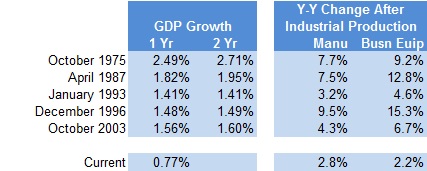
The index was 55.5 in October 1975, and GDP growth in the year after averaged 2.49% (quarterly rate); 2.71% in the 2 years thereafter. However, GDP growth was only 1.56% in year after October 2003. Industrial production grew 9.5% in the year after December 1996, but only 3.2% in the year after January 1993, or only 4.3% in the year after October 2003.
What this shows is that there has been a broad range of results among these five individual time periods despite their ISM index commonality. It would be impossible to come up with a singular narrative to unify these five periods under a single ISM-driven “rule.” Indeed, this more than suggests that the index has little predictive value in and of itself.
However, it would also be a big stretch to assume that the current economy would come close to replicating even the lower tier of the results listed above. Current GDP growth, going back one year, is averaging only 0.77%. That would mean the economy would have to nearly double its pace over the next twelve months just to replicate the last three instances highlighted above. Is that likely, even if the ISM portends relatively good results ahead?
It is exceedingly doubtful. The same analysis applies to each of the parameters above – the current economy does not look anything like the periods that led up to those previous and equivalent ISM readings to justify expectations of reaching those levels of economic proficiency.
Rather than tell us anything about the absolute level of economic growth, the ISM is nothing more than a sentiment indicator of relative changes. In other words, the index is meaningless outside of the wider context in which it is contained. In this case, given the context of manufacturing and end demand, what it is likely indicating is the relative level of demand for inventory at various levels of the supply chain.
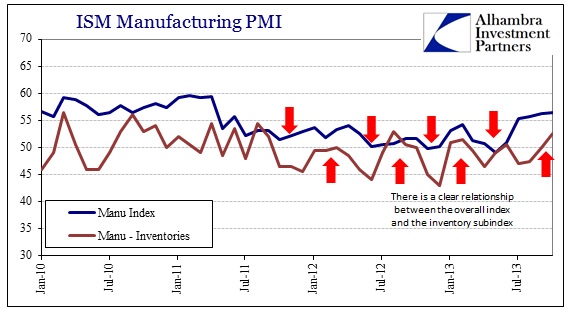
The bottom line is that it is just as reasonable to see an ISM Manufacturing Index result of 56 in an economy with 6% annual growth, 4% annual growth or annual growth close to zero. Again, the index doesn’t tell us about the economy, only relative changes occurring within the larger trend. As much as I decry the statistical machinations surrounding trend-cycle analysis, the theory is sound. The vast majority of variations in the economy are driven by the trend and cycle (the statistics are simply incapable of predicting changes in either, but that doesn’t invalidate their premise). The ISM tells us nothing, or at best, very, very little, about either of those.
Click here to sign up for our free weekly e-newsletter.
“Wealth preservation and accumulation through thoughtful investing.”
For information on Alhambra Investment Partners’ money management services and global portfolio approach to capital preservation, contact us at: jhudak@4kb.d43.myftpupload.com
Stay In Touch