
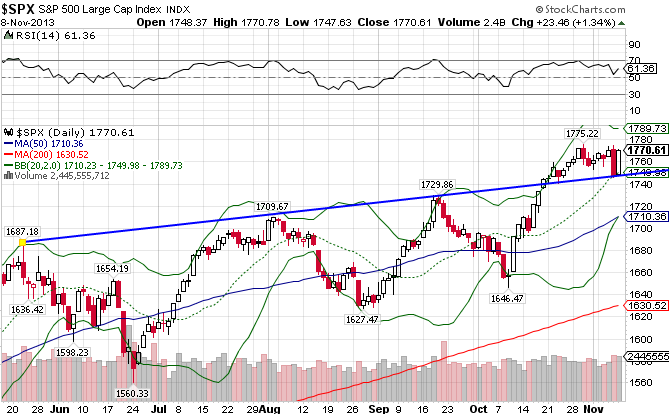
The S&P 500 Index (IVV) has been on a stellar run this year, gaining just over 25% in a little under 11 months while also reaching new all-time highs last week. But the index is treading water of late. It has staggered since hitting all-time highs, unable to gain upward moving momentum before finally giving way this past Thursday. But it did manage to hold support at the 1750 level, and got back much of those losses on Friday. If the index doesn’t manage to clear the 1775, look for a more volatile few weeks, and possibly a correction down to the 1710 level. The S&P 500 is up 26.40% YTD.
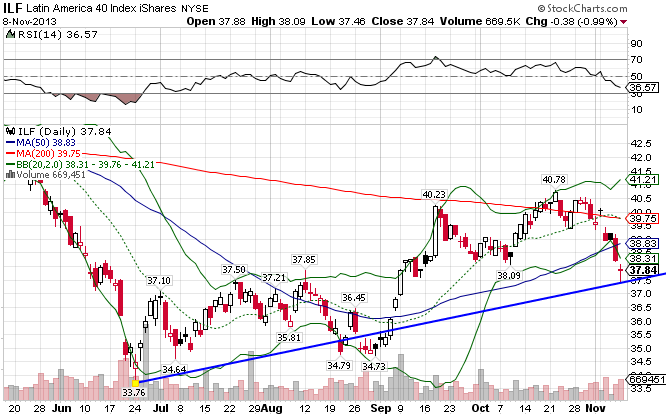
The Latin American market ((ILF)), lagging technically since mid-May, is close to breaking down once again, breaking both moving averages within the last two weeks. If the index doesn’t hold these levels, the 34.70 level comes into play. Given the bearish nature of the commodity markets as of late, and the fact that this region’s economy is uber-dependent on the various commodities, this move down was very likely. The index has recorded a -12.14% loss so far this year.
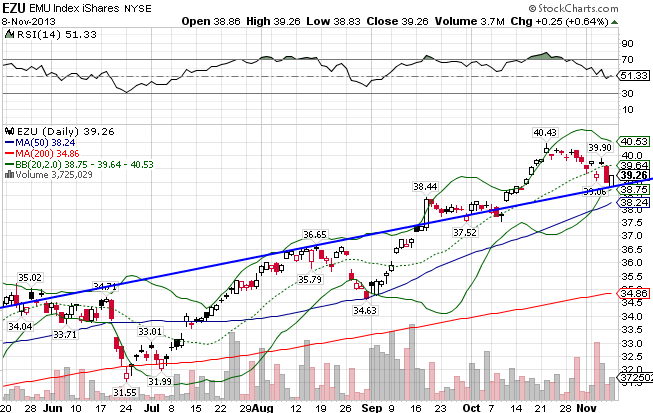
The EMU Index ((EZU)), or the European Economic and Monetary Union, broke out to the upside following a volatile first part of the year. The index has significantly outperformed its US counterpart in the last few months, but has receded at a slightly faster pace in these past couple of weeks. It does sit above support though. The index is up 20.19% for all of 2013.
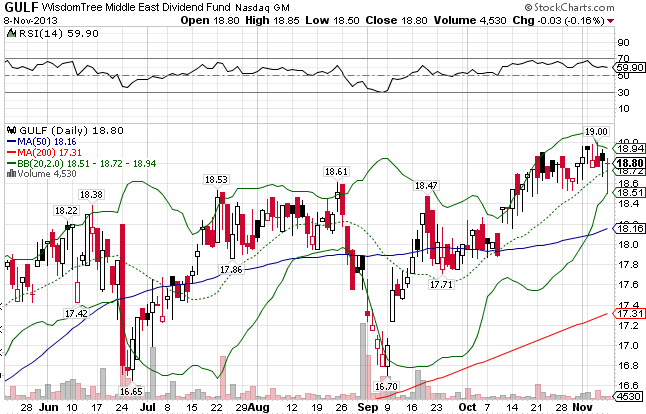
The Middle East ((GULF)) continues to defy the odds, despite tensions throughout the region and a weak commodities market. Given all the turmoil that transpires in the region, you would think the markets in the Middle East would be at the very least shaken. But no, nothing seems to tire this market, as the world’s insatiable demand for crude has created a floor for which any downward movement quickly diminishes and reverses. Not even a bearish turn in the oil markets can upset the Middle eastern markets. The index is up 29.73% YTD.
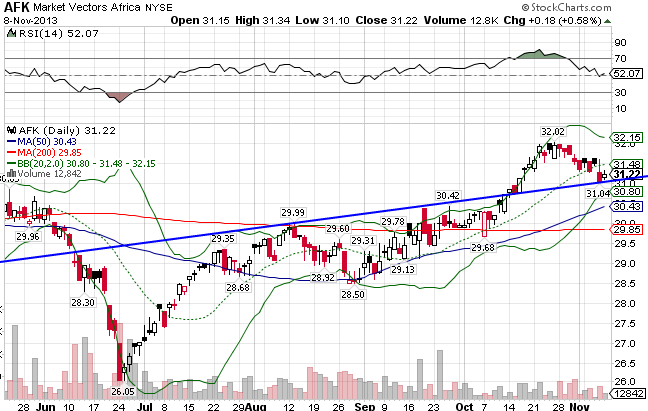
After a stellar run into the 30s, Africa’s market ((AFK)) literally fell off the face of the Earth in June, dropping over 16% in less than a month. Continued upheaval in Egypt, Mali, and surrounding Arab states had managed to put a clamp on Africa’s run. But since June Africa has formed a nice uptrend line, breaking through both moving averages on its way to pre-June highs. Africa is only down slightly for the year, losing 0.41%.
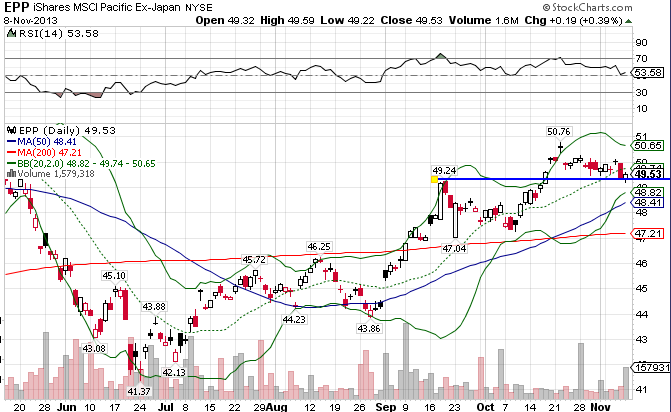
The Chinese economy, along with the Indian and Southeast Asian economies, seem to have finally turned the corner, as the Pacific x-Japan index ((EPP)) broke out to the upside in the last month. The index has managed to break both moving averages and then hold support at the 49.50 level, keeping the uptrend line intact. It also formed a golden cross, where the 50-day crosses over the 200-day MA on its way up, which is a bullish technical sign. The index is up 7.34% YTD.
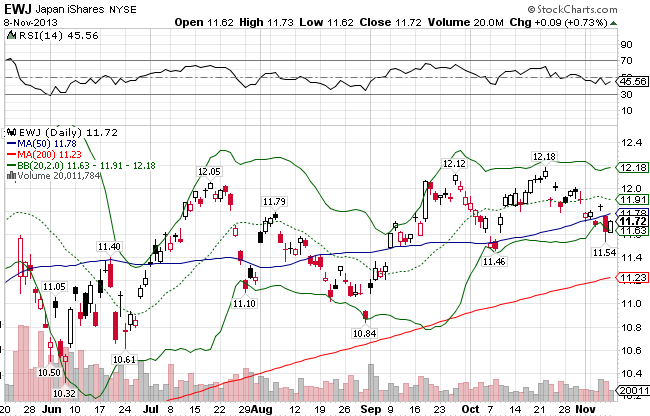
Japan ((EWJ)) was one of the worst performing markets in 2012 before a monstrous run took hold beginning in mid-November, fueled by the BOJ and its continued efforts to devalue the Yen. That all came crashing down in mid-May though, as the index lost over 15% in a little over 2 weeks. While it has bounced up some since, the index has been waffling around and now finds itself just below its 50-day MA again. If it manages to break the 12-12.15 level, the index could be in for a nice run up. Japan is up 20.66% for all of 2013.
Stay In Touch