
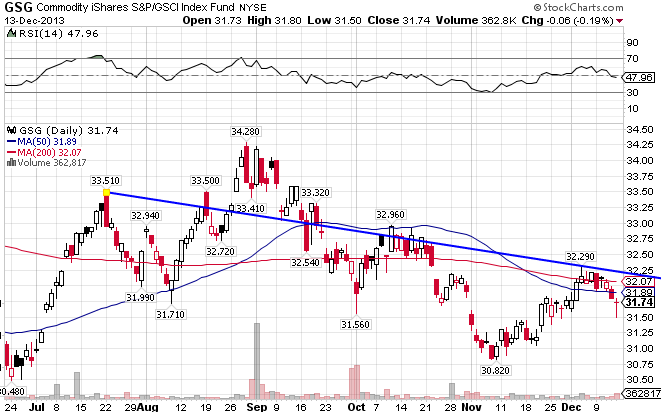
The GSCI Commodity Index ((GSG)) consists primarily of Energy, but also contains Agriculture, Industrial Metals, Livestock, and Precious Metals. After breaking out to the upside in August, the index quickly reversed course and broke down technically, moving below both its 50-day and 200-day moving averages. Prospects look promising in the near future though, as the index managed to hold support at the 31.50 level this past Friday, and with the US Dollar primed for a drop. GSG is down 3.20% year-to-date.
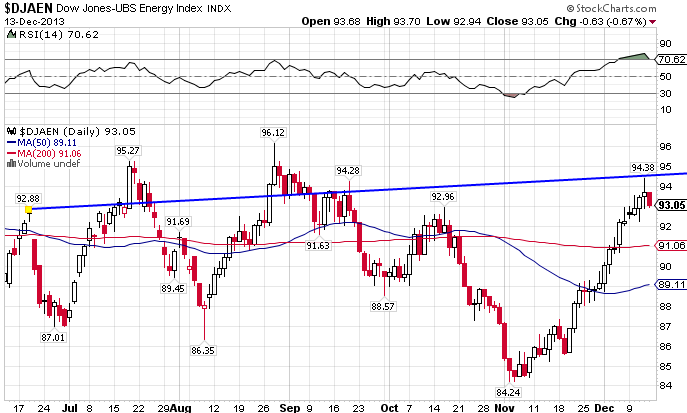
The Dow Jones-AIG Energy Index (JJE) consists of Natural Gas, Crude Oil, Heating Oil, and Unleaded Gas. Since the beginning of November, the index has been on a tear, breaking resistance through both moving averages. The 91 level now has become support. The index is up 4.96% for the year.
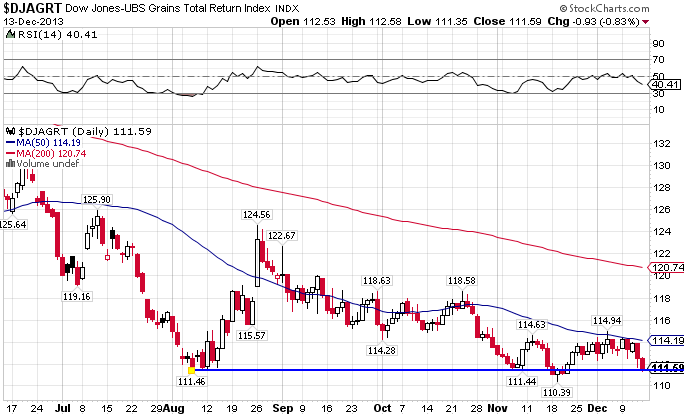
The DJ-AIG Grains Total Return Index ((JJG)) consists of Corn, Wheat, and Soybeans. The index was a spectacular performer in 2012. Things are not looking nearly as well this year though. The index is trying to build a base, but there’s a lot of resistance that needs to be overcome just above where it now stands. Holding support at the 111.40 level is key. The index is down 16.52% so far in 2013.
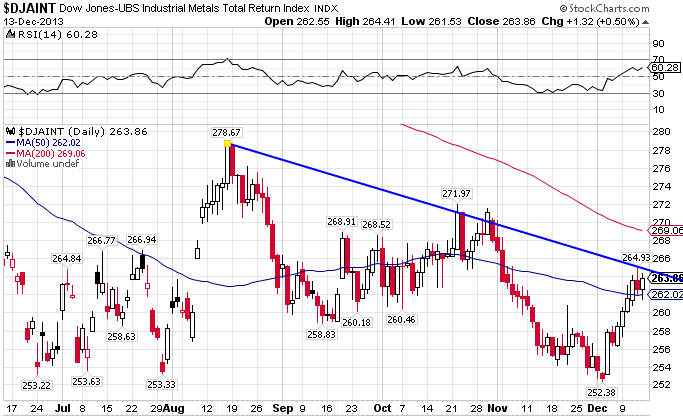
The DJ- AIG Industrial Metals Total return Index ((JJM)) includes Aluminum, Copper, Nickel, and Zinc. The index is in the process of forming a bottom. It currently resides below its 200-day MA and just above strong support at the 260 level. JJM has been the one of the hardest hit by weakening global picture, down 16.72% YTD.
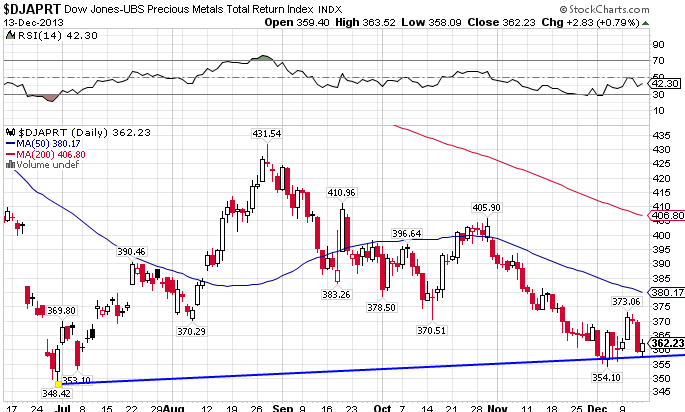
The DJ-AIG Precious Metals Index ((JJP)) includes Gold and Silver. The gold market has been very volatile of late, tumbling over 10% in a matter of days in mid-April, and once again in June. But it seems that the index may have finally reached a bottom at the 348 level, as long as it can avoid breaking under the 355 level. JJP is the worst performer of 2013 though, down 30.26% in just a little less than a year.
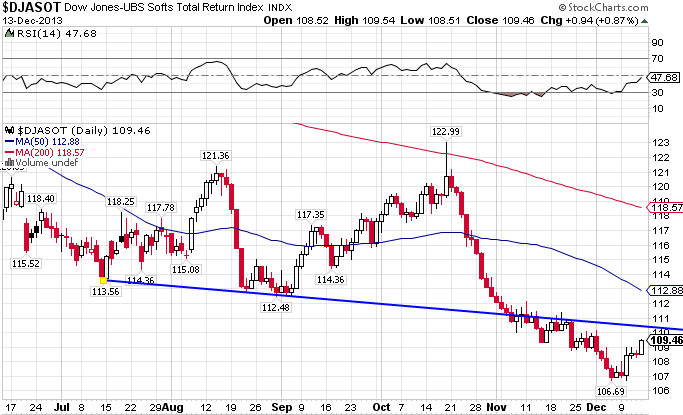
The DJ-AIG Softs Index ((JJS)) includes Coffee, Cotton, and Sugar. JJS is very weak technically, and has been for some time. It fell off the edge of a cliff in the past two months, after hitting resistance at the 200-day MA back in October. In the process it also broke strong support at the 111 level. The index is down 18.43% YTD.
Stay In Touch