
While everyone gears up for the holiday season, particularly the Christmas break, economists and retailers are on the edge of their computer screens trying to determine and gauge the health of the economy. Is QE finally working? The latest retail sales figures seemed to have provided some optimism toward that conclusion.
But this is also the time of the year when seasonal adjustments are most pronounced, rendering the month-to-month comparisons dangerous (at best). Take online shopping, for example. There is no question that it is changing the retail marketplace as more and more shoppers tend to find better deals online. Cyber Monday may soon pass Black Friday (or a combination of Black Friday and Thanksgiving, should that trend continue).
As such, the portion of the latest Retail Sales report for November from the Census Bureau buoyed many nervous Fed adherents. According to MarketWatch, holiday sales “zoomed” online. The article provided a handy chart that “confirmed” the exuberance.
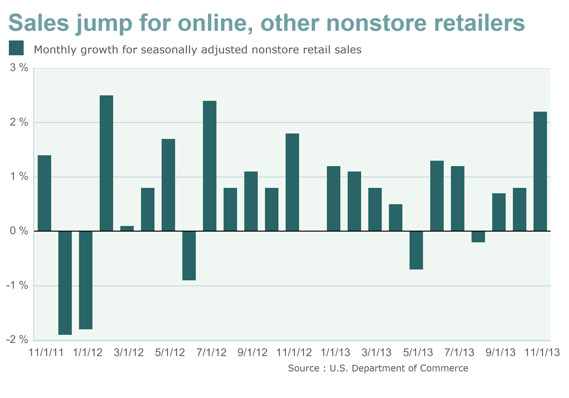
Month-over-month, nonstore retailers supposedly saw a 2.2% jump (over October 2013). Using year-over-year comparisons, however, the opposite picture emerges.
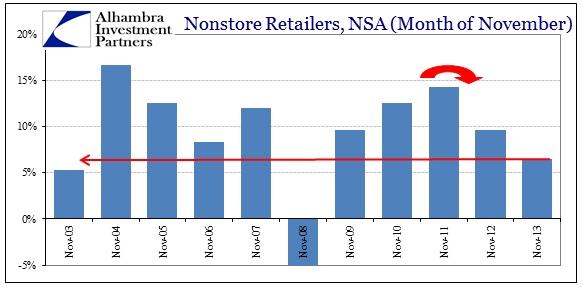
Online growth for November in 2013 was the worst for that month (outside of 2008) since before online sales were such a huge force in retailing. Further, the growth rate was down significantly from even November 2012 (which wasn’t exactly sizzling). It’s possible that as the online sales method matures and grows in proportion that growth rates will naturally scale back, but I don’t believe that is the case here particularly since more and more effort is being expended toward managing sales in that direction (cost effective for retailers, after all).
The dichotomy between the M/M and Y/Y is explainable in the calendar. As we have heard over and over again, Thanksgiving was late this year and that purportedly had retailers worried over the compressed shopping season. The ARIMA X-13 seasonal adjustment software that the Census Bureau employs in its M/M estimates has taken this into account. So, when comparing in seasonal terms the numbers will be “adjusted” upward as if the compressed holiday season did not take place (making it, in the estimation of statisticians, comparing apples to apples).
The lower growth rate for online sales in November 2013 compared to November 2012, then, may simply be an artifact of that atypical holiday shopping period. But in order to gain that apples to apples comparison the Census Bureau is simply assuming that those sales will be made up in December. They are projecting what the growth rate might be if the holiday season were more normal. If the calendar is, indeed, responsible for the lower results, then anyone using the optimistic M/M numbers is counting on sales that have not actually happened. That is a dangerous proposition, particularly when growth rates are slowing across the board.
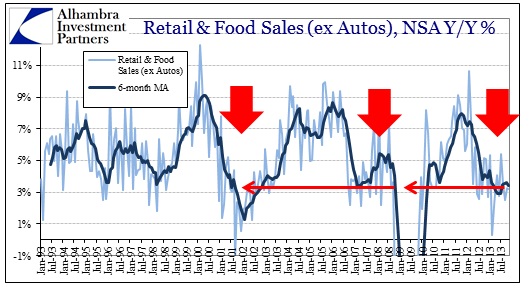
The unadjusted, Y/Y totals are what actually were booked by retailers. Again, it is consistent with a mild recession, not the QE panacea Chairman Bernanke promised in November 2010 and again in September 2012.
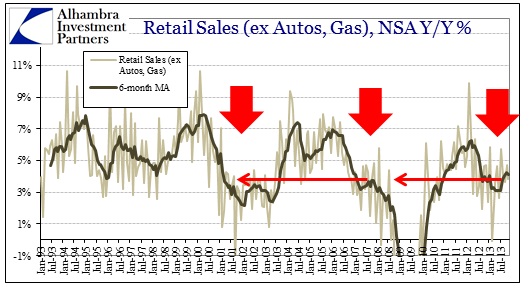
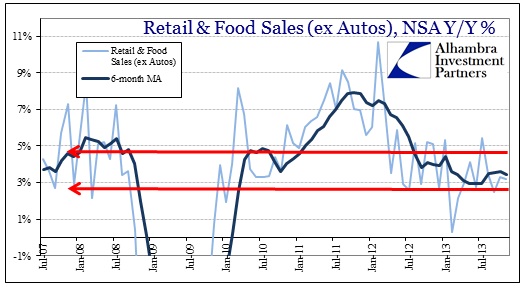
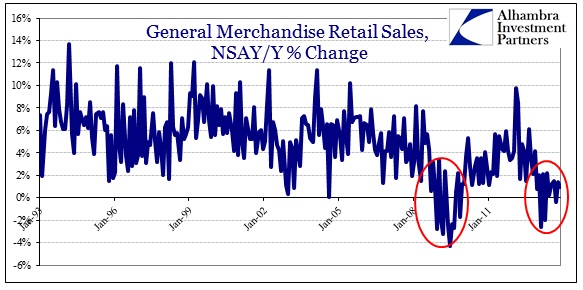
Not only is this the season of seasonal adjustments, it is also the season that highlights the bifurcation in the economy. Those at the upper income levels, most exposed to asset inflation, are finding a positive shopping year. That is reflected in not only auto sales, but big ticket durable goods – both segments that reflect access to credit. Apart from that narrow segment, the rest of the economy is distressed. General Merchandise stores saw almost no growth in November, a feature that has been common since the end of last year.
In what scenario does that reflect a forward-moving and healthy economic rebound? Again, in case anyone would suggest a structural explanation as more sales move into the virtual experience, the combined growth of nonstores and general merchandise is showing the same recession-like symptoms as the rest of the “wrong” part of the branched economy.
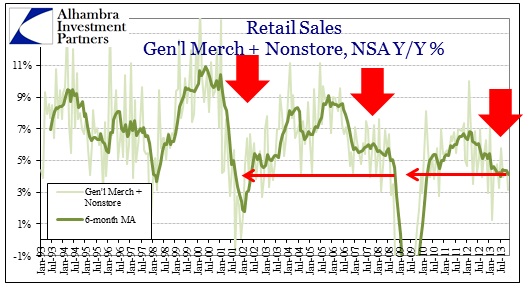
From December 2007 to September 2008, a nasty recessionary environment in its own right, Y/Y growth in Nonstore + General Merchandise averaged 5.06%. In all of 2013, the same segments averaged 3.97%, so even accounting for any differences in inflation calculations there is much to the similarity and comparison of the two periods.
Finally, again appealing to common sense, are the “robust”, seasonally adjusted figures consistent with other sources? From the New York Times:
More than 141 million people shopped online or in stores between Thursday and Sunday, according to a survey released Sunday afternoon by the retail federation, an increase of about 1 percent over last year. And the average amount each consumer spent, or planned to spend by the end of Sunday, went down, dropping to $407.02 from $423.55. Total spending for the weekend this year was expected to be $57.4 billion, a decrease of nearly 3 percent from last year’s $59.1 billion.
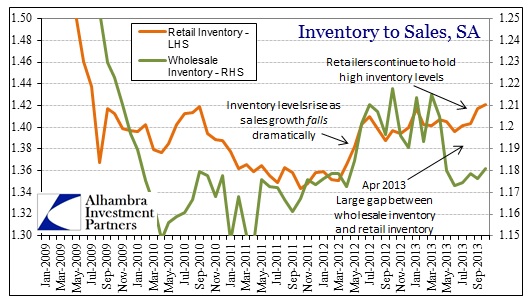
That leads in to the final data point I will present here. Inventories at retailers have risen steadily since June. In October, inventory levels reached the highest point in this cycle just as sales growth has been diminishing (effect and cause). Maybe the seasonal adjustment process is correct and December will be a banner month. If 2012 is a guide, that would be a bad bet.
Click here to sign up for our free weekly e-newsletter.
“Wealth preservation and accumulation through thoughtful investing.”
For information on Alhambra Investment Partners’ money management services and global portfolio approach to capital preservation, contact us at: jhudak@4kb.d43.myftpupload.com
Stay In Touch