
Finally, after several months of delays, the Census Bureau has obtained enough survey information to publish the full picture of real estate construction. And it is historic.
Coming on the day when mortgage applications drop to a fifteen year low, the data presented does not disappoint the buildup in suspense. First, though, the pace of the collapse in mortgages is absolutely astounding – refi applications are now 70% below year-ago levels. Even applications for purchases have now fallen significantly, down 6% in the latest week and down 16% against the same week in 2012. With that in mind, there should be no surprise to see some considerable upset in construction.
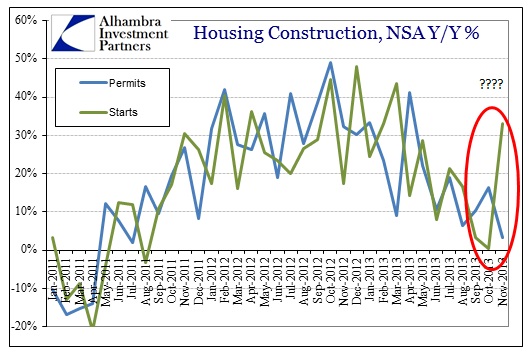
In terms of permits for new construction activity across the US, that is exactly what we see. The growth rate in November was the lowest since July 2011, really before the latest mini-bubble began. However, the pace of housing starts absolutely exploded higher, contradicting all the dire activity elsewhere. After rising just 3.4% and 0.4% in September and October, respectively, new starts apparently jumped 33% in November Y/Y.
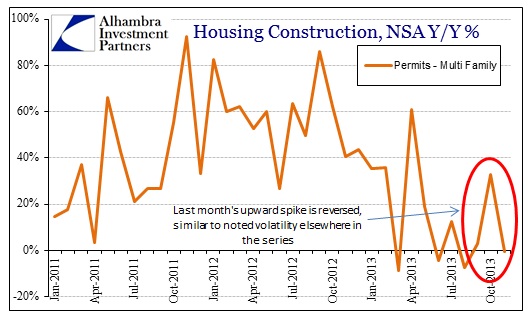
This dichotomy was not limited to multi-family apartment dwellings, as you might surmise from the usual volatility in that particular series. Going back to last month’s read on permits in the multi-family sector, there was a volatile move then that has been, as expected, erased.
And when we combine that with starts in multi-family structures, we see that kind of volatility throughout.
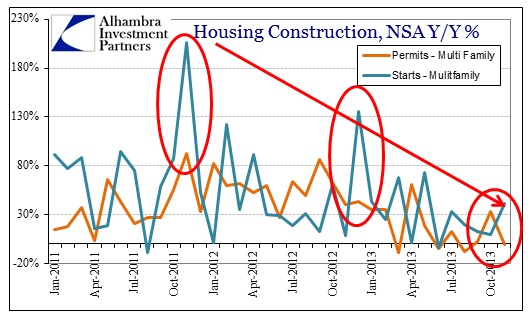
In fact, this kind of divergence between starts and permits appears quite normal in Novembers and Decembers, which should lead to questions about the Census Bureau’s seasonal adjustment capabilities. Beyond that, the divergence between permits and starts this November is the smallest since the housing mini-bubble was first reignited back in 2011.
With that in mind, it is the volatility between starts and permits in single-family houses that is the real anomaly. Again, beginning just with permits, the familiar and intuitive (given this year’s mortgage and credit activity) pattern continues.
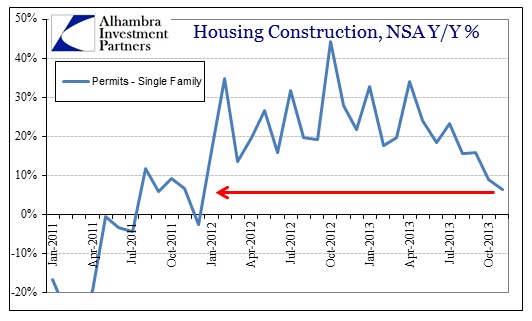
November permits were only 6.4% greater than the previous November, a rate not seen since December 2011. Further, the trend could not be clearer.
When we add starts, this divergence in what is typically a very stable comparative relationship suddenly appears.
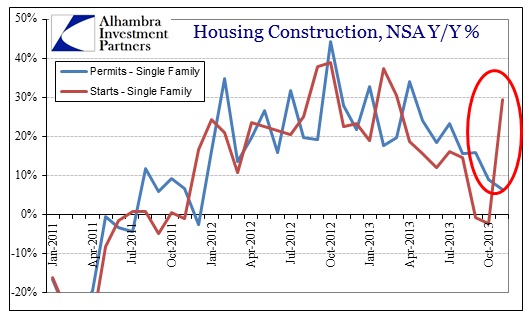
To put this into context, the growth rates of housing starts in September and October were both slightly negative, -0.8% and -2.2%, respectively. Then start activity surged, purportedly to +29.4% in November. I suppose you might make the case that there was pent up activity awaiting to be unleashed after those two months of declines, but that is not matched by permits in any way. It stands to reason, particularly in single-family structures, that starts would follow permits in close proximity (as you can see clearly in the chart above).
In fact, on only two occasions going back to 1960 (647 monthly data points) have we seen starts diverge so far from permits. The last time was April 2010 as the home buyer credit was introducing a false dawn in housing expectations. Construction activity that briefly perked up then was very quickly reversed once it became clear the tax credit had only moved forward limited activity.
The other occasion was January 1964, in circumstances very similar to today. There was a relatively deep housing slump accompanying the 1960 double-dip recession, followed by an uneven rebound that lasted about two and a half years.
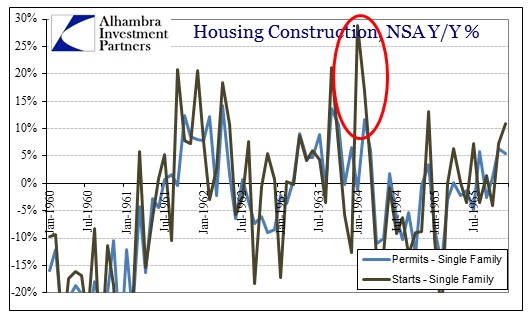
The divergence between starts and permits, like 2010, occurred right at the end of that cycle.
It is interesting that these historic anomalies occur in relatively similar manners and cycles, but the larger takeaway here, for me, is that there appears to be signal noise in the starts data. This is particularly compelling since the relationship between permits and starts in single-family houses is normally quite close and predictable (to a certain extent). That would suggest next month will show a “normalization” toward the much more durable permits trend – heading toward more negative numbers.
Click here to sign up for our free weekly e-newsletter.
“Wealth preservation and accumulation through thoughtful investing.”
For information on Alhambra Investment Partners’ money management services and global portfolio approach to capital preservation, contact us at: jhudak@4kb.d43.myftpupload.com
Stay In Touch