
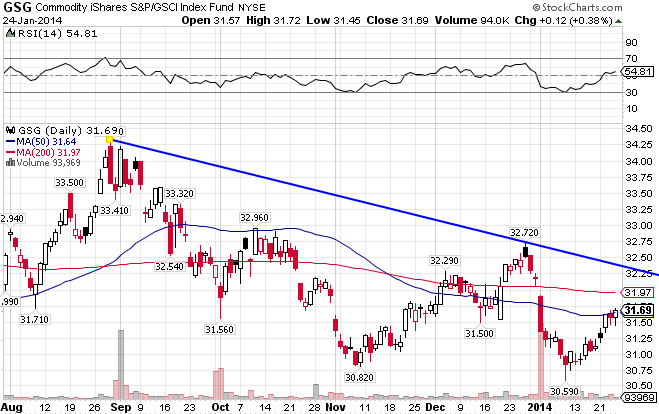
The GSCI Commodity Index ((GSG)) consists primarily of Energy, but also contains Agriculture, Industrial Metals, Livestock, and Precious Metals. After breaking out to the upside in August, the index quickly reversed course and broke down technically, moving below both its 50-day and 200-day moving averages. Prospects look promising in the near future though, as the index managed to hold support at the 31.50 level this past Friday. GSG is down 1.55% year-to-date.
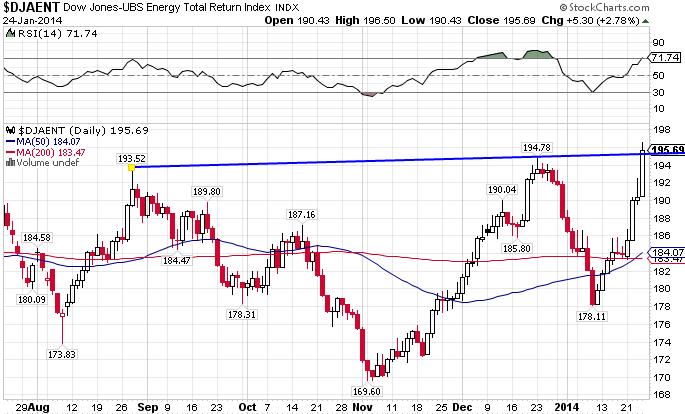
The Dow Jones-AIG Energy Index (JJE) consists of Natural Gas, Crude Oil, Heating Oil, and Unleaded Gas. Since the beginning of November, the index has been on a tear, breaking resistance through both moving averages. The 195 level now has become support. The index is up 4.96% for the year.
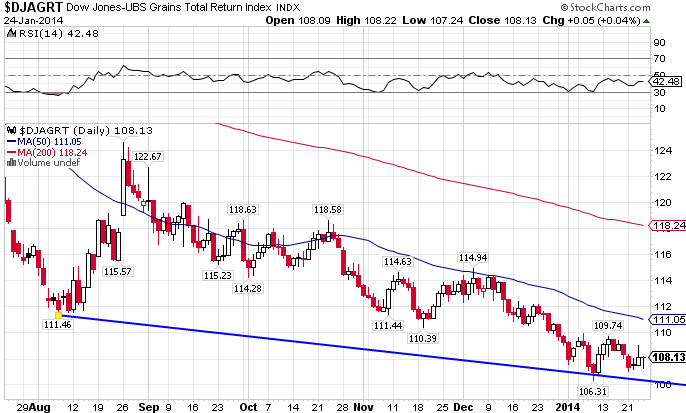
The DJ-AIG Grains Total Return Index ((JJG)) consists of Corn, Wheat, and Soybeans. The index was a spectacular performer in 2012. Things were bleak 2013, as the index lost its gains plus more. As for 2014, while it’s trying to build a base, there’s a lot of resistance that needs to be overcome just above where it now stands. Holding support at the 108 level is key. The index is down 0.83% so far in 2013.
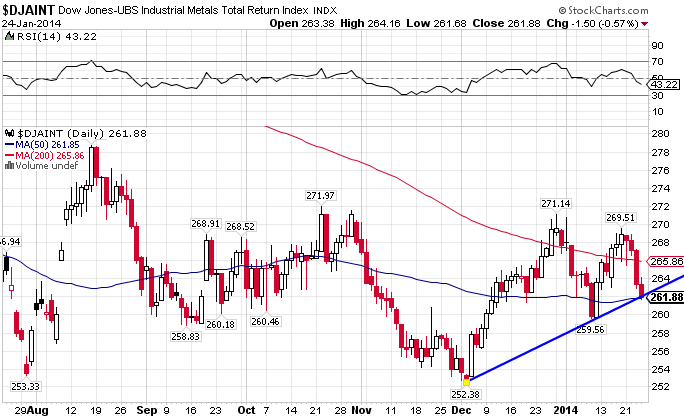
The DJ- AIG Industrial Metals Total return Index ((JJM)) includes Aluminum, Copper, Nickel, and Zinc. The index is in the process of forming a bottom. It currently resides below its 200-day MA and just above strong support at the 262 level. JJM was one of the hardest hit by the weakening global picture in 2013, but its looking to reverse course this year. This week is key. JJM is down 2.46% YTD.
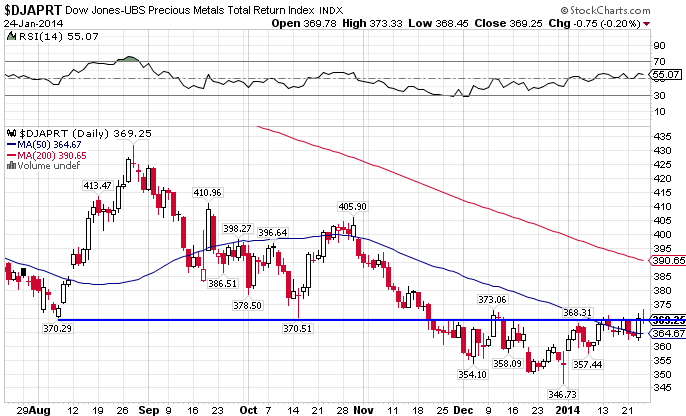
The DJ-AIG Precious Metals Index ((JJP)) includes Gold and Silver. The gold market was extremely volatile in 2013, tumbling over 10% in a matter of days in mid-April and once again in June, on its way to a 32% drop for the year. But it seems that the index may have finally reached a bottom at the 350 level, and managed to break through resistance at the 50-day this past week. JJP is the best performer of 2014 so far, up 4.04%.
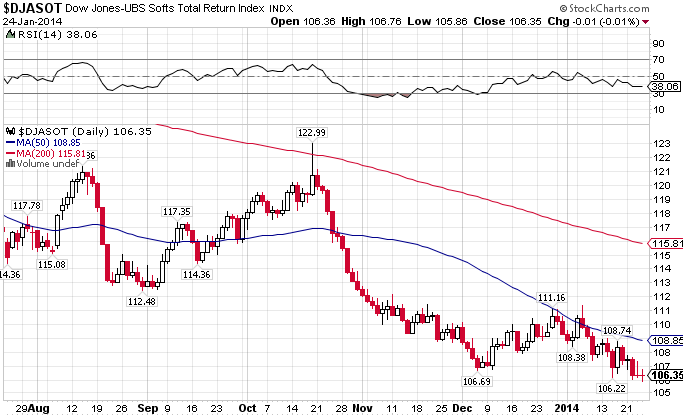
The DJ-AIG Softs Index ((JJS)) includes Coffee, Cotton, and Sugar. JJS is very weak technically, and has been for some time. It fell off a cliff towards the end of last year, and hasn’t really found a firm footing since. The index is down 3.13% YTD.
Stay In Touch