
There is, of course, an intermediate step between mortgage finance and home construction – new home sales. So it stands to reason that given the collapse in mortgage finance (demand) and the correlated slide in construction that home sales would be of a similar pattern. The latest figures from the Census Bureau thus contain no surprising information, unless one was predisposed to seek out the wintry elucidation.
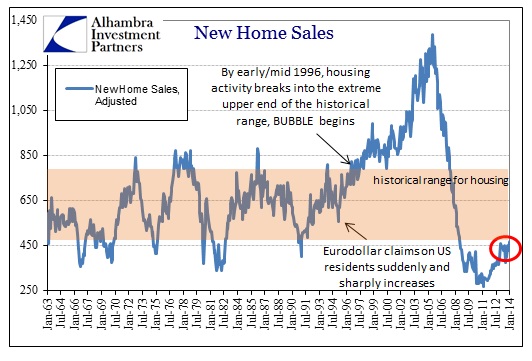
Most of the chatter about new home sales has referred to the new five-year high in January. The rate (SAAR) of 468k has not been seen since July 2008. However, applying actual context, that is still well short of the bottom end of the historical range. Further, an annual rate of 468k is not appreciably different than the 458k of last January; meaning the Y-Y seasonally adjusted growth rate was just over 2%.
On an unadjusted basis, the actual number of homes sold in January 2014 was 34k, which was only 6% more than January 2013. So while it may appear to be a new high in the SAAR, what is perhaps far more important, particularly to bubble markets, is momentum is about spent.
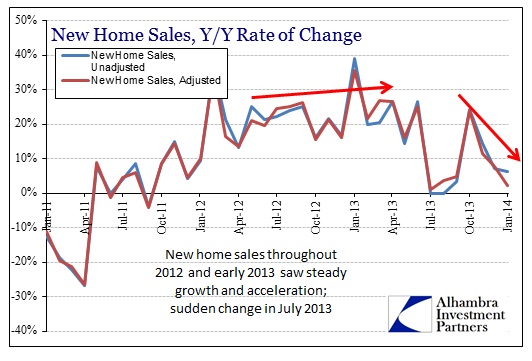
The results from October and November that so encouraged economists have, like so many other macro indications, reversed and disappointed. That applies in equal application to prices that have clearly reached at least an elongated pause (if not portending something worse).
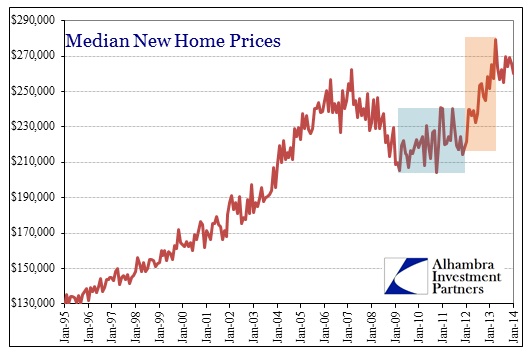
It was maybe inevitable to see such an inflection given that home price appreciation, driven by institutional “money” flowing near direct from the FOMC and its Open Market Desk, in the past few years “bested” anything seen during the last and “great” housing bubble.

While there were already signs that price appreciation was having a moderately negative impact on the housing sector as early as April of last year, apparently the double dose of price momentum and interest rate “shock” are proving too much to withstand. As noted repeatedly, that is a terrible blow to the primary channel for monetary policy; enfeebled as it has been.
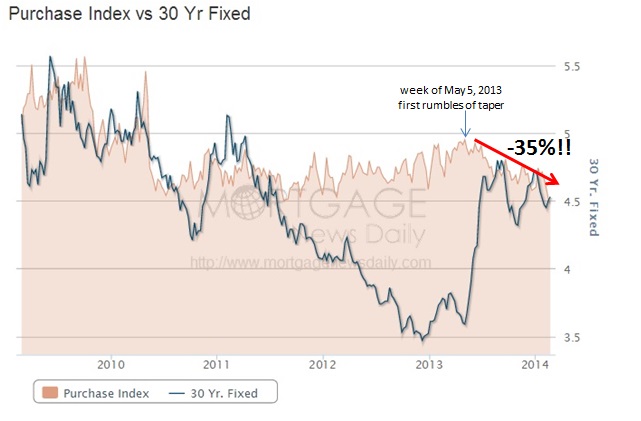
The refi index was down another 11.5% in the latest week, while the mortgage purchase index continues to sink, now down 20% Y-Y and close to 35% since the May 2013 peak.
If there is to be another inflection, this time back upward, I am having trouble seeing exactly how and why that would be the case. What realistic factors are there that can offset and reverse all these “headwinds”? More important, if this bubble paradigm can wither under the taper pressures, what other bubbles might find themselves in similar reckoning to such rediscovered “tail risk”?
Click here to sign up for our free weekly e-newsletter.
“Wealth preservation and accumulation through thoughtful investing.”
For information on Alhambra Investment Partners’ money management services and global portfolio approach to capital preservation, contact us at: jhudak@4kb.d43.myftpupload.com
Stay In Touch