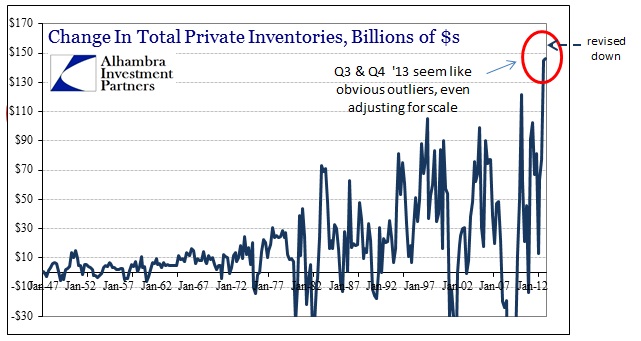
The preliminary revisions to Q4 2013 GDP subtracted a significant portion off what was previously believed much more robust, thus making Q3 more and more of an outlier. We knew that 2013 (and even late 2012) had a very heavy inventory component, far more than is “typical”, and that observation survived these adjustments despite a similar downward revision in Q4 inventory growth. What remains is what I noted of the advance release, namely that inventory growth has been uniquely strong and outside of historical precedence.
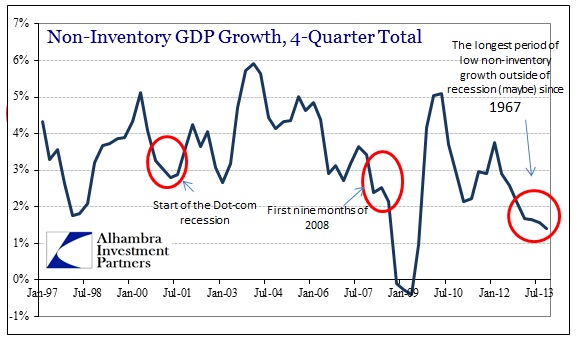
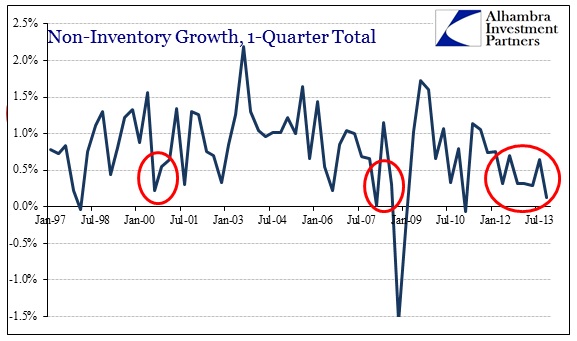
The effect on GDP growth away from inventory was thus a bit more muted, but still to the downside.
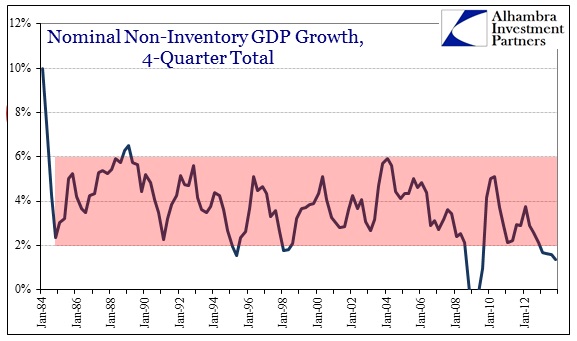
What is remarkable about nominal GDP growth outside of inventory is that it has been extremely stable, almost exclusively within the range of 2%-6% since the end of the Great Inflation. Take away the enormous asset bubbles and dramatic currency instability, as well as the hollowing of the US economy and growing impoverishment, and it almost looks like a Great “Moderation.”
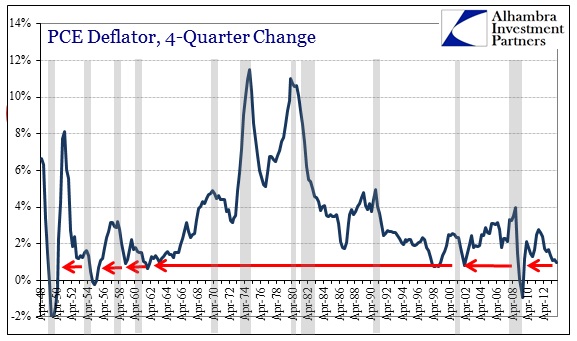
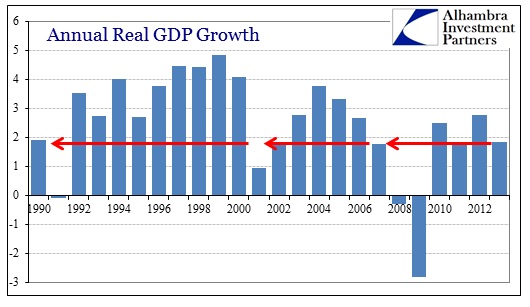
That would suggest that the variation in economic factors “causing”, or at least signaling, recession or dislocation is left to inflation and inventory. We know where inventories are in the historical context, but that leaves inflation as somewhat of a contradictory factor here. What we have is almost unique in economic history, where low inflation rates are at levels consistent with recession (outside the Great Inflation period), but so low as to keep “real” calculations from becoming negative. That does not disturb the dire contexts in which those apparently positive figures exist, however. To some that nets out on the growth side, but I would submit it is, at best, ambiguous (and misleading at worst).
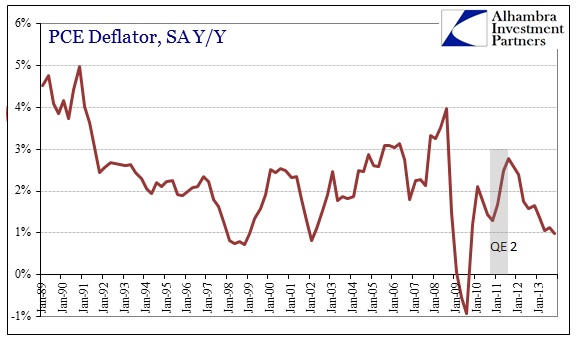
So as nominal non-inventory GDP conspicuously falls and remains below its more durable historical range, indicating quite strongly something very much amiss, it is matched by these official inflation measures that have been falling since the end of QE2. The net result is weakness that is not too weak to be overtly contractionary.
That may end up simply being an issue of timing. Where the primary difference between pre-crash 2008 and 2013 in terms of non-inventory GDP is about 2-2.5% in nominal terms, that is the same spread as calculated inflation rates. The PCE deflator most recently is just less than 1%, whereas it measured about 3.5% heading into 2008. Taking that into consideration, the economy in 2013 is therefore very much like the economy in the first half of 2008 – overly dependent on inventory stocking aside a much weaker growth environment than estimated at the time.
That makes intuitive sense as then, as now, businesses were dependent on mainstream economics and economists’ predictions about near-future prospects. And then, as now, those projections were ultimately far too optimistic for much the same reasons, leading to this same dichotomy between what was coming and to what levels businesses ordered their inventory.
If that is correct, and I think the data points in that direction, that would mean the economy as notated by non-inventory GDP and inflation is actually weaker than is observed (below). At the very least, if the only factor holding up the economy is rosy predictions of future growth based on monetary policies (setting inventory), that is itself a powerful indictment.
Click here to sign up for our free weekly e-newsletter.
“Wealth preservation and accumulation through thoughtful investing.”
For information on Alhambra Investment Partners’ money management services and global portfolio approach to capital preservation, contact us at: jhudak@4kb.d43.myftpupload.com

Stay In Touch