
When the ISM index is sky high, it is proof of the magic of monetary acumen. Now that the more-important non-manufacturing index has fallen to a 4-year low, confusion reigns as to interpretations. My interest in the ISM is as it has always been, a relative measure of changes (not absolute levels). Thus, more important to me is not that 4-year low, but the pace at which it has fallen.
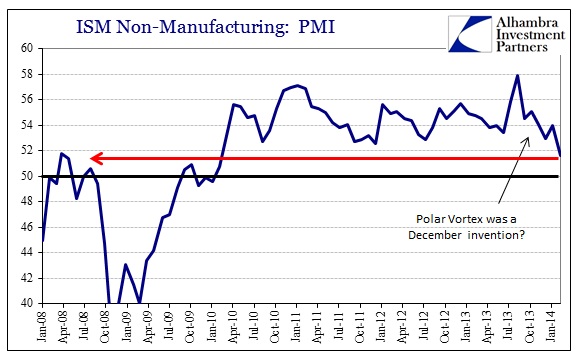
I don’t think there is any doubt that this is related to the inventory mini-cycle, adding more to the weight of evidence of that. The 2013 peak occurred in August, the month before WalMart’s leaked “discomfort” with its growing inventories astride lackluster selling. That continued through the holiday season that was particularly divergent from QE-driven expectations from earlier in the year.
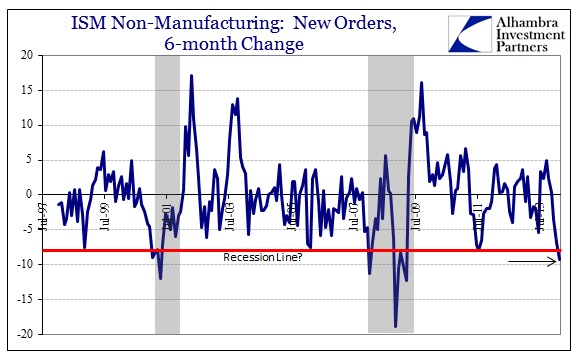
With those two extremes in mind, it may not be so surprising just how quickly and steeply activity has changed. And that, again, is what is most striking here.
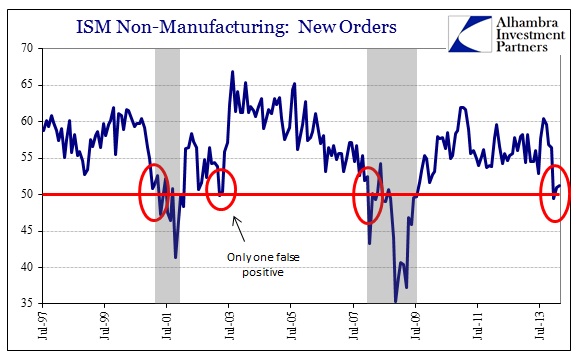
My colleague Doug Terry had noted the contraction indication in the New Orders component in January (for the December 2013 index), including that such an indication is very much consistent with recession. In the two months of data since, that notion has been furthered by comparing relative changes. So while the overall New Orders index has stabilized around 50, the 6-month rate of change is very conspicuous.
Only twice have we seen such a steep change of direction, and both occurred during recession. On three occasions, a drop of similar (but lower) magnitude transpired but quickly bounced away, and none of them were really recessionary. All three of those (November 1998, February 2006, July 2011) were steep changes in relative direction, but were simply inflections from high growth rates to lower growth rates rather than from low growth to recession. In other words, those marked the first downslope off the “cycle” peaks rather than closer to cyclical troughs.
Adding some confirmation of that interpretation is the subindex for Employment, an almost exact mirror of New Orders (as you would expect).
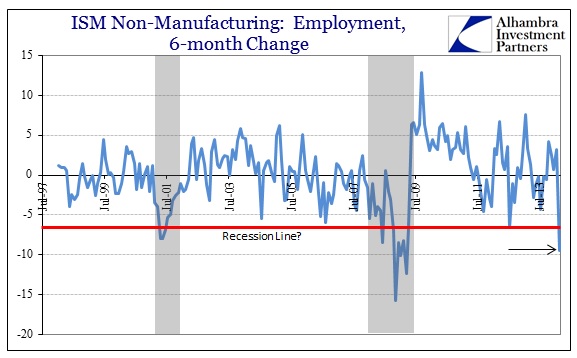
Here, however, there is far less volatility, thus indicating that there is perhaps something more meaningful when these high-magnitude rates appear.
Whatever the ultimate interpretation, or how this goes in the future, it is at least another indication that the economy continues to disobey the planned path. Some may want to wait for warmer weather to rule out snow-driven lunacy, but that really isn’t necessary given at least a cursory scan of the state of the economy, from income to capex to global trade. With all these “headwinds” it’s pretty much standard from an unbiased perspective.
Click here to sign up for our free weekly e-newsletter.
“Wealth preservation and accumulation through thoughtful investing.”
For information on Alhambra Investment Partners’ money management services and global portfolio approach to capital preservation, contact us at: jhudak@4kb.d43.myftpupload.com
Stay In Touch