
There has been a lot of discussion about the Chinese credit markets, and rightfully so, as unusual events are in the midst of probing “market” sensibilities as they relate to great imbalances. Along that line, this passage in a CNBC article caught my attention:
Strict government controls, and the fact that state-owned companies own the bulk of government debt prevent the market from acting like a truly contested market, she said. Meanwhile, the same problem is prevalent in the corporate bond market, which is equally owned by banks, insurance firms and fund managers.
“The result is a manufactured spread between government bonds, state-owned firms’ bonds and private firms’ corporate bonds,” she said.
That really doesn’t tell us anything we don’t already know, as we have had good experience with artificial markets ourselves. And that is what interested me the most, mainly that how the analyst described the Chinese market in the two paragraphs above could easily pass for an accurate description of the US credit markets (and Europe, for that matter). We may think there is a free market difference between here and China, but with ZIRP and QE US banks and foreign banks operating onshore here are essentially “state owned.” And if anyone thinks corporate spreads are “market-based” instead of manufactured they live in a different world altogether.
This artificiality gives rise to the runaway situation where credit growth drives itself as a positive feedback loop – the more borrowing takes place after a certain point, the more borrowing needs to take place to keep it all together (I know, Minsky again). That is why I believe the housing market in the US is in serious jeopardy of retrenchment – the bursting of a second (albeit smaller) bubble in such a condensed period of time can potentially have a generational effect on housing.
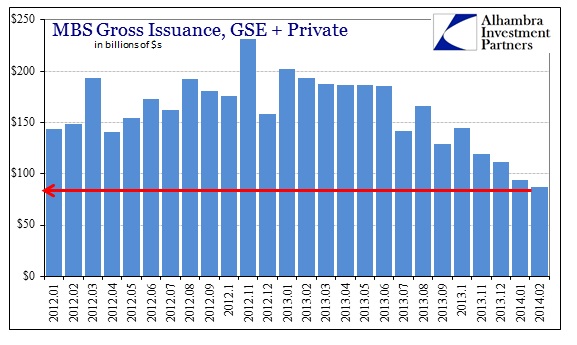
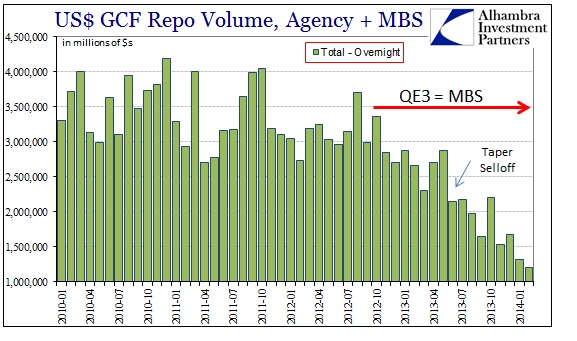
And this retrenchment was born not of manufactured spreads but of the sudden reappearance of markets awoken from QE-induced slumber. That more than hints at a certain and concerning fragility that is incorporated throughout the post-crisis financial rebuild effort, as you would expect as much since leverage created via “policy” is far less robust than leverage created via organic means. You cannot claim organic fundamentals when a relatively minor increase in the mortgage rate, from record lows to near record lows, produces a 60-70% collapse in MBS (issuance and finance). Such incongruence is unambiguous evidence of fragility.
I think that is most evident in the new subprime, or at least the version that has taken on those characteristics within this latest policy “cycle.” High yield debt and leveraged loans (syndicated loans of “low quality” corporate obligors that are bought and sold in discrete packages) in 2013 obliterated the previous cycle peak in 2007.
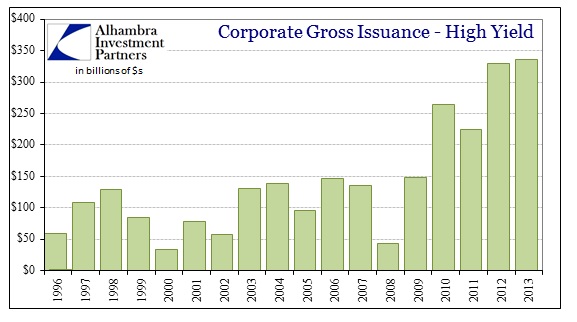
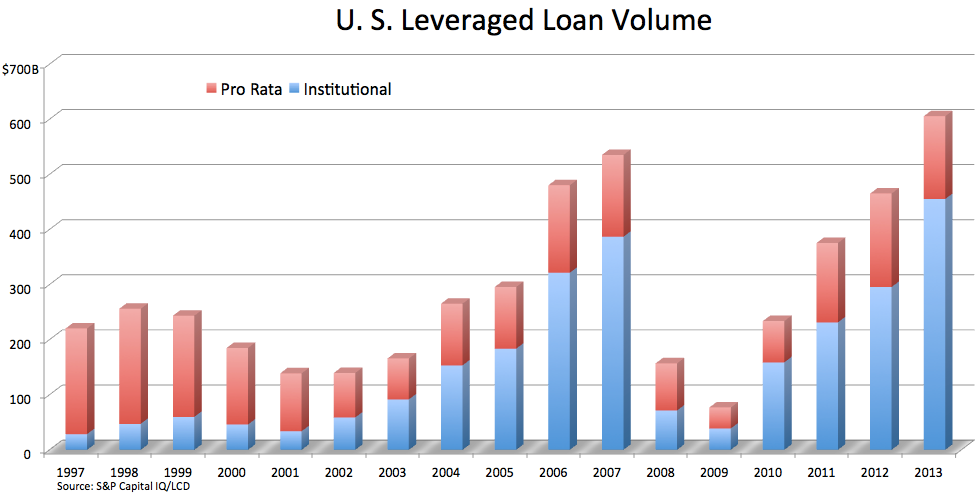
Leveraged loan volume cited above includes only new issuance, meaning that is the marginal expansion of corporate “subprime” borrowing. There is a definite pace to it, as well as junk bonds, clearly moving in cycles that were accelerated beyond historical experience (2004-07, 2010-13). This leverage cycle features no mystery as demand for it is proportional the degree to which spreads and returns are manufactured toward “stimulus.”
Thinking about it in economic terms, there was almost $1 trillion in junk/leveraged loans issued in 2013 that did what, exactly, for the US economy?
It’s not just the pace of credit creation that catches the manipulated spreads here, as quality is assuredly one of the primary factors in determining “cycles.” According to Moody’s, via Barrons:
The average covenant-quality score for high-yield bonds in North America dropped to 4.36 last month from 3.84 in January on Moody’s five-point scale, in which 1 denotes the strongest investor protections and 5 the weakest.
We have been hearing for more than a year that this new subprime has been featuring reduced quality. In terms of leveraged loans, “cov-lite” is now more than half of high yield lending.
As of Jan. 31, the share of loans in the S&P/LSTA Leveraged Loan Index without maintenance covenants grew to a record 50.04%, from 46% at the end of 2013.
Clearly, financial covenants – once a hallmark of secured loans – haven’t been the norm for the new-issue market for some time. In January, 53% of new-issue institutional volume launched was covenant-lite, down from 68% in December.
Despite that steady deterioration, there has been exactly zero in the way of perturbation in the leveraged loan market. In other words, the worse these loans get, the more stable prices have become – a telltale sign of bubble mania – which can only be interpreted as participants are convinced nothing bad can happen, ever. Instead, fear is not of loss but of missing out, the very inversion of basic investment fundamentals.

In the space of only a year or so, the 10-year UST rate is about 100 bps higher, whereas junk bond yields and leveraged loans are about even or lower (particularly in the case of leveraged loans). How is that congruent to what we know about markets? Indeed, that inversion extends in almost every direction, where the riskiest markets have exhibited the most stable and rising prices (I would very much include US equities in that).
The primary problem with this inversion is that it all comes back to misinterpretations of liquidity. If you buy into the leveraged loan premise that exists right now, you are essentially thinking that you will be able to get out if you need to should conditions change (Greater Fool). But that assumption is based on artificial conditions of liquidity that are evident right now, itself manufactured by policy extension. In other words, the volume and bids that exists in these markets today are by no means an indication of what conditions might be like once an inflection is reached (which is inevitable). Narrow spreads like this are an illusion that conditions are favorable and will remain so, but what they really signify is this inversion where risk appears risk-free because leverage has been added solely to policy considerations. The artificiality almost guarantees that will not be the case in relatively short order as revulsion is geometrically more powerful on the downside than complacency on the upside.
It is perhaps the most conspicuous signal of such great imbalance (in dollars) evident at this moment. One final note: tangential to spreads and the rationalizations of them is the historically low default rate. While that may be used as more comfort to buy such junk with reckless abandon, low default rates, particularly this low, are instead indicative of cyclical peaks. But what may be more concerning is that low default rates that persist, due to manufactured spreads and abundant funding, only bunch defaults closer together at that inflection point in the future. In other words, liquidity does not solve solvency problems, only delays the reckoning. Doing so in systemic fashion is the very definition of pro-cyclicality.
Click here to sign up for our free weekly e-newsletter.
“Wealth preservation and accumulation through thoughtful investing.”
For information on Alhambra Investment Partners’ money management services and global portfolio approach to capital preservation, contact us at: jhudak@4kb.d43.myftpupload.com
Stay In Touch