
I normally don’t pay much attention to mutual fund flows as they don’t have nearly the explanatory power or relevance in what is surely a more complicated and topographically inconsistent “market.” Equity mutual funds are no longer the primary measurement tool of “small” investor demand. That does not mean, however, that unusual events cannot contain something more than passing interest or notable curiosity.
In the latest weekly data from ICI, fund flows moved out of domestic equity at a rather brisk pace in the last week in April (-$3.9 billion). That result by itself is not meaningful, though it contrasts very sharply with recent behavior. What was somewhat odd was that current performance in every other class of mutual funds was well within the rather stolid tolerances of the past few months – only the flow out of domestic equities stands out.
There is absolutely no way to cull any conclusion from that one data point, other than save it for future reference. What we are trying to identify is any systemic shift in “market” perceptions through dated and backward indications in preferences. As I said above, mutual funds don’t hold the marginal heft they once did, as anyone can plainly discern that ETF’s have risen in prominence and usage.
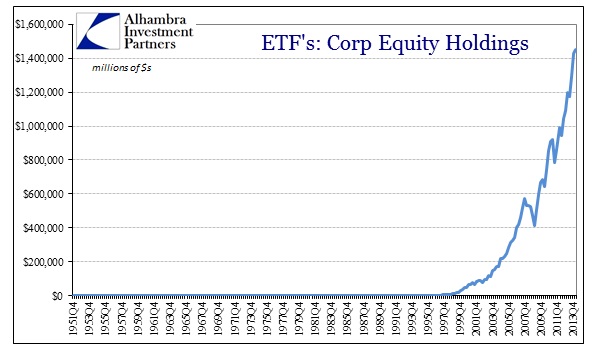
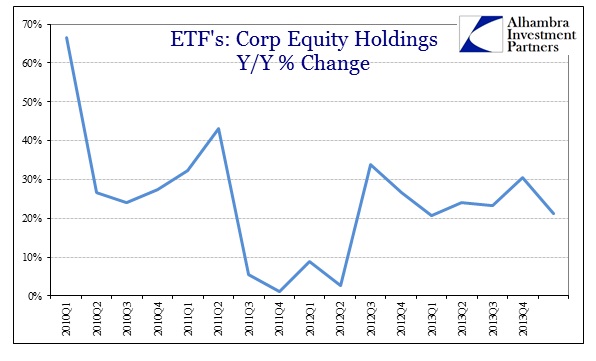
Unfortunately, like margin debt, the latest figures are for March. But even being largely stale by now, we can still try to tease out meaningful analysis. Growth rates in ETF holdings of stocks (including foreign) have been robust since the 2009 bottom (with the exception of 2011).
Obviously, stock prices are going to factor into the value of ETF holdings. But if you plot the increase in the S&P 500 against the change in holdings shown above, you can get a cursory sense of additional flow – with the caveat that the S&P 500 may only be largely representative of a portion of total holdings, meaning that any superior performance in other market segments (like small caps) may be wrongly interpreted here as additional flow.
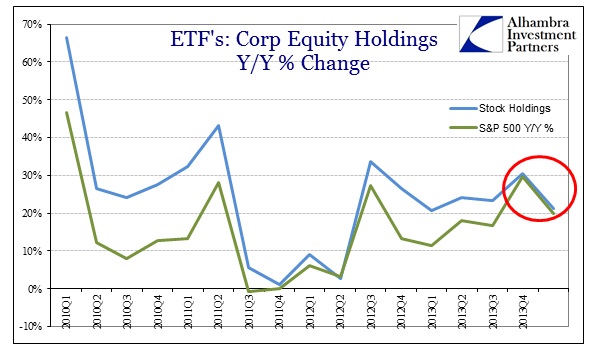
It is interesting to note that the gap between the growth in the market value of holdings and the performance of the S&P 500 is the narrowest since late 2011/early 2012 when investors were fretting (rightfully, in my opinion) over the euro crisis (and then ignoring the widespread downturn in the US economy and global trade). There certainly appears to be a QE-effect to the pattern here as well, especially the change off QE2 and then back into QE3.
This most recent convergence may be something else entirely, perhaps even the downturn in emerging market stocks moving into 2014. If that is only a minor factor, and I would tend toward that interpretation, then my rough sketch here may be somewhat close to representative of investor propensity into ETF’s, thereby suggesting a narrowing channel of risk appetite.
Given just how rough these figures are and the high potential for misinterpretation, any such even partial conclusion toward that end begs for confirmation. That may have, in fact, come in the middle of last month when Hedge Fund Research, Inc., put out a press release touting the new record for the amount of assets held by the hedge fund industry. The research outfit reported $26 billion in net flows for the first quarter of 2014, the largest such gain since just before the 2011 correction.
Of course, the term hedge fund itself has undergone a massive shift like that of the overall market and may not mean what it was originally intended (to actually hedge), but the statement itself singles out “Equity Hedge” strategies as gaining, by far, the most interest.
First quarter inflows were led by Equity Hedge (EH) strategies, with investors allocating over $16.3 billion in new capital to EH, expanding total capital for the strategy to $761 billion, the largest area of hedge fund capital. The 1Q14 inflow into EH was the largest quarterly inflow since 1Q 2007.
The statement above actually understates the interest in EH since that group holds only 28% of all hedge fund assets but gained 62% of the inflows. It is also interesting that the hedge fund industry as a whole, very much including EH strategies (as you would expect), have underperformed radically in this bubble but very much in the past eighteen months. So again, this is far from conclusive but another factor pointing to a potential movement away from risk, or at least increasing interest in derisking to even a limited degree.
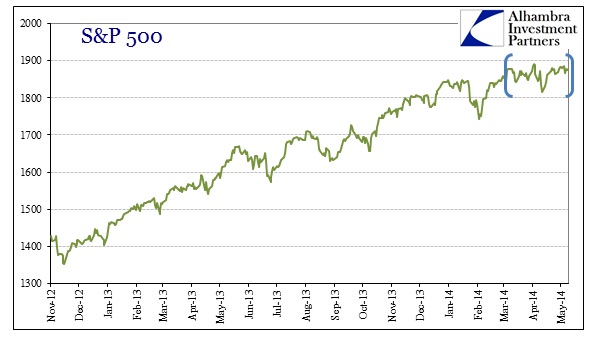
With market indices hitting new highs now that might suggest that all of this is just too dated to be relevant. Since January was a negative month for equities, and widespread at that, these figures may simply be picking up a trend that is no longer valid. My own sense is that there is increasing resistance in the market that certainly wasn’t evident in 2013, so I am less likely to simply dismiss these pieces. In reality, the market has gone sideways, more or less, since early December, and that is even more the case since the end of February.
One more “market” captured by the stasis of increasing uncertainty?
Click here to sign up for our free weekly e-newsletter.
“Wealth preservation and accumulation through thoughtful investing.”
For information on Alhambra Investment Partners’ money management services and global portfolio approach to capital preservation, contact us at: jhudak@4kb.d43.myftpupload.com
Stay In Touch