
There are a few more pieces of economic accounts to put together before the disaster of a first quarter can be left behind (if only until the next set of revisions). A major part of the economic picture is derived from productivity, as that feature defines sustainability and ties together labor growth with productive investment. Capitalism is the combination of labor and “capital” (truly defined, not some monetary measure) to gain synergy beyond the short run.
However, estimating productivity is obscenely difficult. The current manner of of doing so is really an artificial bridge, rather than a probabilistic survey or even imputation. The BLS defines it as:
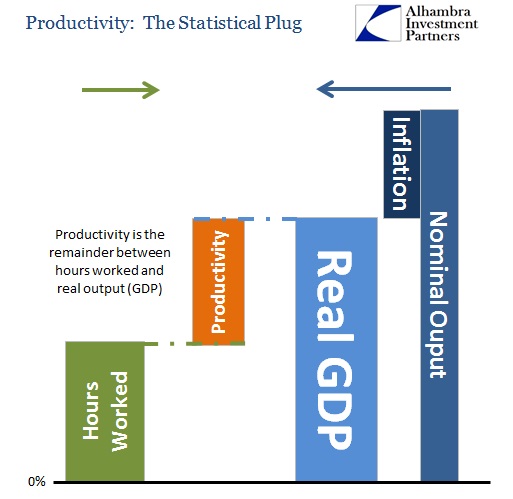
Labor productivity, or output per hour, is calculated by dividing an index of real output by an index of hours worked of all persons, including employees, proprietors, and unpaid family workers.
So we start with an index of real output (the BLS bases its estimate on BEA’s GDP calculation, but only uses the “business sector” which amounts to about 75% of the total), derived itself from calculations of nominal GDP minus generalized price changes or inflation (unless Japanification results in “deflation”, badly defined here, which would actually be an addition). On the other side, the BLS calculates its own estimates of total hours worked. Productivity is what is left over that plugs the gap between the two.
Under more “normal” circumstances, there is little controversy regarding this method. But with the highly negative first quarter in terms of GDP, productivity was estimated to be highly negative as well. The latest revision, authored and released in early June, was for -1.1% in output against +2.2% hours worked. The net plug line, productivity, was then calculated at a rather large -3.2%.
Given the latter revision to GDP at the end of June that sent it all the way from -1% to -2.9%, however, productivity is going to be revised significantly lower still in August. It doesn’t look like BLS is about to change its estimate of labor utilization – which I think is the problem here.
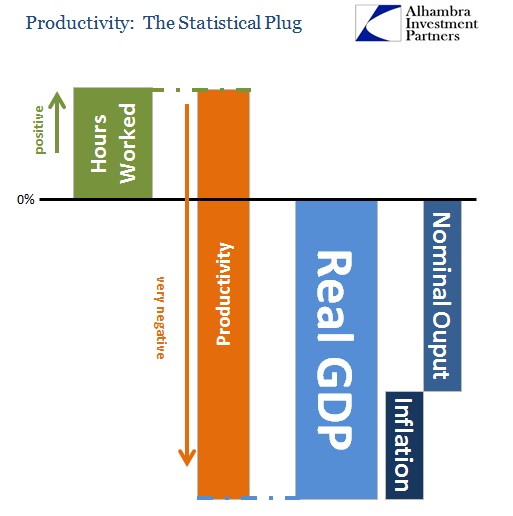
While we don’t know what the final tally will look like, a reasonable guess places this in the realm of fantasy. We are supposed to believe that the business sector, largely services, continued hiring at a rate that was unbelievably unproductive as the economy slowed noticeably. It is here where these “one-off” factors are supposed to offer an explanation for this as a statistical aberration (like healthcare), but that is only, if actually valid, true on top of the supposed winter phenomena. In other words, the economy was already bad and these other factors purportedly just made it worse.
Even removing any of these possible peculiarities, what is left is still a negative GDP quarter with consumer spending at its worst since 2009. Further, business investment and even construction were negative (total fixed investment contributed -0.27% to GDP; the biggest setback since 2009), as capital investment was atrocious in the first quarter (weather too?).
What we are left with is the idea that a highly unusual downshift in output was totally ignored by businesses to a historically high detriment to their own profitability? It wasn’t as if the economy was accelerating broadly up to that point, either. Christmas sales were the worst since 2009, while business investment continued barely at replacement levels. I find it hard to believe that businesses overall did absolutely nothing to counteract such a high and growing degree of inefficiency.
To put in perspective, the second calculation after productivity is unit labor costs. The BLS describes that as:
BLS defines unit labor costs as the ratio of hourly compensation to labor productivity; increases in hourly compensation tend to increase unit labor costs and increases in output per hour tend to reduce them.
In the first quarter we had actually saw the combination of the two downside factors – increasing compensation coupled to lower output. The net result was +5.7% in unit labor costs, a rather large increase itself. However, if productivity is revised lower, as surely it will have to unless the BLS relents on its employment trend, then unit labor costs surged unbelievably (perhaps historically) in the first three months this year.
I think that defines, for me, the problem I have with the two economic series coming together in this fashion. As I stated before, there is something wrong where the economy clearly suffers as it has yet employment supposedly had its best run since the trough in 2009. That kind of incongruity, absent some kind of corroboration, makes this all more than a bit suspect.
My own suspicion remains squarely that the Establishment Survey and the current benchmarks, and thus downstream employment figures including total hours worked, is statistically unsuited to the current condition. That has led to an overstatement of actual employment, including the recessionary decline in Q1 and likely the strangely stable payroll growth since. In terms of productivity then, what would make far more sense is that businesses would have reacted to the disaster as they typically do, and payroll growth was far less (if not negative) than currently assumed.
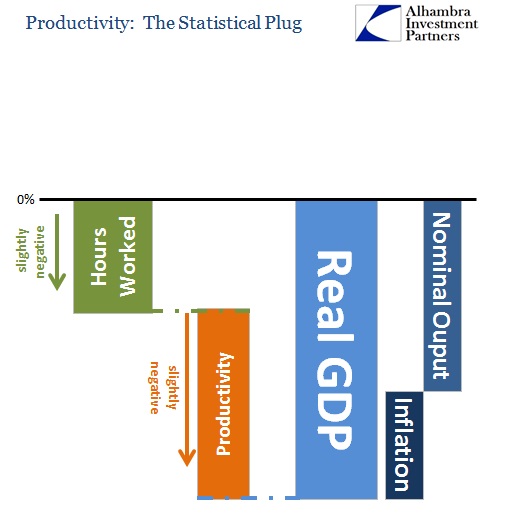
A more reasonable estimation, in my analysis, is as shown above. It is likely that productivity was still negative, but I highly doubt it was historically so since there is absolutely nothing else in the data that would confirm that. While the mainstream will continue to move along with the idea of Q1 as a statistical aberration, nothing like this has ever been seen in the data going back to 1947.
It is beyond questionable when all these historically conspicuous calculations are necessary in order to preserve the idea of an economy still functioning well enough to be thought of as recovery or growth – almost rigging the data to fit the theory. Instead, it seems alternatively very simple that the economy is far worse off than expected, and that labor estimates are similarly situated. It doesn’t take a huge flight of fancy to see that in all these figures, and that pure observation and common sense argue for that without the need to resort to highly irregular calculations.
Again, the goal here is corroboration among all these various figures. That means not just that they move in the same direction at the same time, but more importantly that logical consistency is maintained steadily throughout. The current narrative violates that standard in so many ways, particularly as it relates to the “strongest labor market since 2009” set directly against the weakest economic results since the same. Productivity here argues, in common sense terms, directly against the labor view.
Click here to sign up for our free weekly e-newsletter.
“Wealth preservation and accumulation through thoughtful investing.”
For information on Alhambra Investment Partners’ money management services and global portfolio approach to capital preservation, contact us at: jhudak@4kb.d43.myftpupload.com
Stay In Touch