
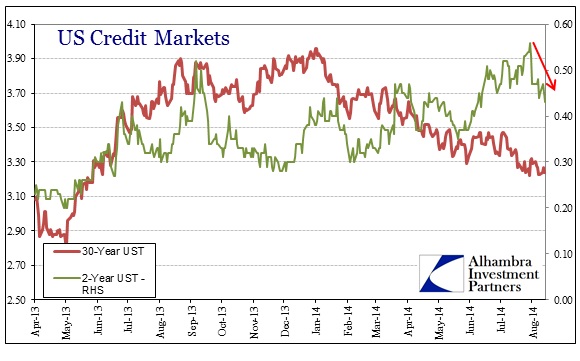
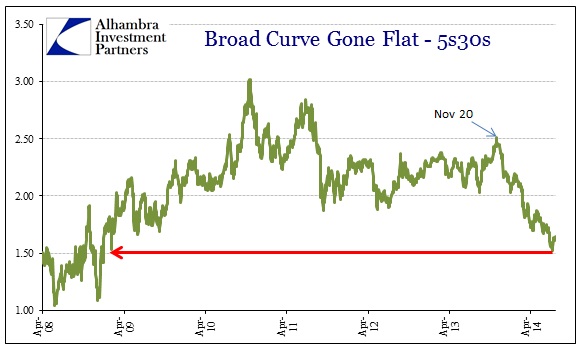
The driving theme for credit markets for all of 2014 so far has been a rapid flattening in the treasury and funding curves that had not “wanted” to abate for any reason. Whether it was the short-lived infatuation with wage “inflation” or any of the contradictory and mushish assessments from any of the suits sitting at the FOMC, the curves were genuinely imprinted in the bearish fashion. Since the latter part of July, however, there has been at least a relaxation if not something more significant.
Of course, that flattening trend has been interrupted here and there by short-coverings and hedging or whatnot, so the recent steepening could play out exactly as those have done in a return to more flattening after some time. The difference here, however, is a bit deeper as the steepening is being inaugurated by the short end bid rather than the long end (which is still bid, just less so). In other words, the rapidity by which flattening took place was largely due to selling on the short end and buying longer. In the past few weeks, the buying now extends to all sections where the short end is also bid and to a much greater degree than the long end.
If it was just the treasury curve I would likely pay it little attention, but the same exact “pattern” has been duplicated in funding markets. The eurodollar curve, for instance, had remained largely uninteresting inside of 2017 as the Fed’s “forward guidance” has put little emphasis on that section (though the lack of rising rates there were more than a little contradictory to the planned rate hikes, or at least the chatter attempting to convince participants that it was/is a real policy threat). Just as the 2-year treasury has been bid hard lately, so have the dollars being offered in eurodollars inside the “policy window.”
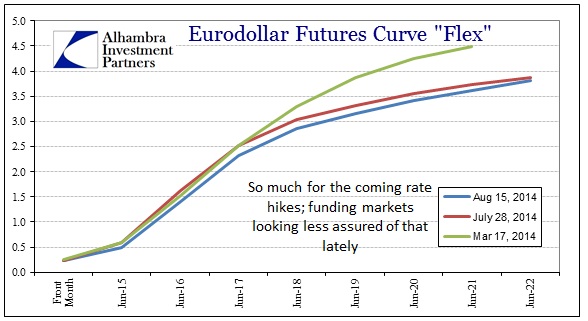
There had not previously been much change in the front part of the curve between March and the end of July, save for May 29 where rates dropped noticeably in what was likely heavy hedging activity. The front section of the current curve, August 15, has dropped almost to where it was at that low on May 29, and now adding some appreciable daylight with the previous immobility. That would suggest, among other interpretations, less cumulative expectations for interest rate hikes in the short run, adding weight to the short end of the treasury curve.
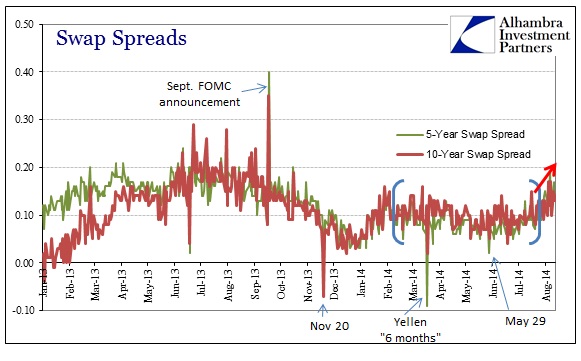
That May 29 action smelled far more of a hedging episode than anything we see now. That is corroborated by swap spreads, where that single day stood out in near-zero spreads that are the tell-tale sign of a hedged irregularity. Since the end of July, swap spreads are running up and out of their recent range. That would seem to indicate repositioning for a steeper yield curve, but not one like that of last summer’s selloff with the overall curve and interest rates rising, but now with the overall curve and interest rates dropping.
The cumulative nature of all these pieces is what makes me wonder if this is more significant than anything seen this year, and thus that there are very large worries about not just long-term growth in the US but short-term as well. That would likely include any assessments of co-related problems in Europe, given the close ties in these “markets”, but I don’t think that alone is enough to offer such a potentially massive inflection such as this.
There is another element that I believe adds weight to that interpretation, going back to the initiation of the flattening trends themselves. In every section of the yield curve, last year’s steepening stopped at exactly November 20, 2013, without any obvious reason for that date or coordination.
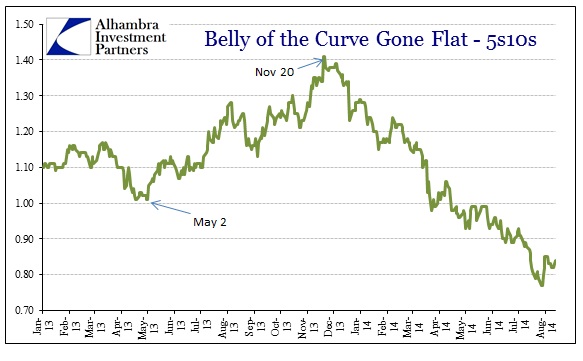
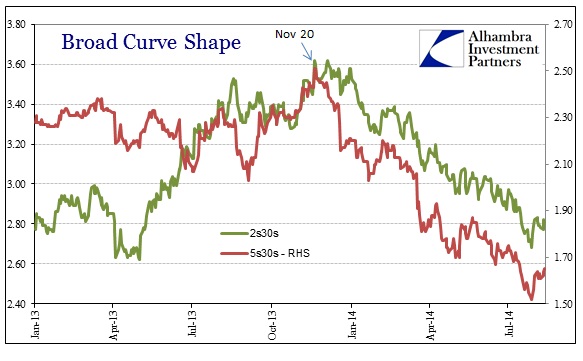
Even the 2s30s ended its steepening trend on November 20, though flattening did not become more apparent until the end of December. The only significant action that coincides with all of these heavy and significant bearish repositioning is the distinct change in the Open Market Desk’s SOMA targets. Prior to November 20, the Fed paid very little attention to the 10-year space, buying up almost nothing of that part of the treasury curve even as it was sold off rather hard through the summer and into autumn.
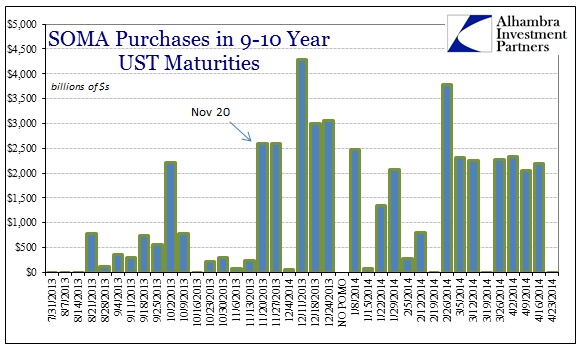
The week of November 20 saw both the change in SOMA purchasing shown above as well as a swaps “anomaly” where spreads suddenly and dramatically dropped negative. I have maintained that was related to MBS and bank dealers getting caught “the wrong way” and run over to an extreme as a result of being badly positioned for the selloff in TBA. The relation of those two events looks like, and I am speculating here, a backdoor and hidden bailout of an MBS dealer(s).
Even with the buying resolve of the Open Market Desk on the 10-year, rates still rose further through the end of last year, but the yield curve shape, as clearly evident in the charts above, began to move in the opposite direction. I think the deeper credit market participants got the signal from none other than the Fed about very real concerns in the mortgage, and thus housing, space. If this is correct, then the bearishness expressed (possibly) by that program change (if you have to bailout the mortgage market, there are no positive implications) began to snowball in the other direction as an almost officially-sanctioned pessimism.
In other words, if the Fed was so concerned about mortgage markets (and the 10-year treasury is the benchmark for much of that) then the implications ran beyond simple (to some) finance. At the same time, various FOMC members and staff began expressing doubts about QE and even long-term economic potential. I also noted what I thought was a determined effort to end QE because of optimal control considerations (“may be pushing the recovery off track”) that would have been very much correlated with what was already shaping the curve going back to November 20. To some that may have looked like simply prudent caution given the unknowns and variability, but to a bond market already acknowledged of the Fed’s new presence it would or could have been very reinforcing.
This would all mean that the Fed acted contrary to its own expressed desire to input “optimism” into all market participants as it accorded to rational expectations theory. However, the exigent needs of the mortgage market, which it itself created by the very nature of QE and the level of intrusion, may have interfered with that attempt and sent credit markets reeling in the opposite direction ahead of all this current doubt. If this new trend at the short end holds firm, then all the designs about “forward guidance” have been for nothing.
Once again, this interpretation might be far too premature and I have intentionally left out other important factors so as to not get too entangled and off topic, but it is an intriguing possibility that the Fed kicked off the bearishness with its own foolishness. By attempting to have it both ways, exiting QE while maintaining perfectly artificial placidity and order, it may end up getting nothing it really wanted as this would mean the Fed was its own worst enemy (especially in a rational expectations theory context). That would include, it seems, not just finance but also housing and mortgages as well as the overall economy. The attempt to spin this year’s contractionary aberration as exactly that would have been far more believable without having the bond market consistently contradicting it; all going back, curiously, to November 20.
Click here to sign up for our free weekly e-newsletter.
“Wealth preservation and accumulation through thoughtful investing.”
For information on Alhambra Investment Partners’ money management services and global portfolio approach to capital preservation, contact us at: jhudak@4kb.d43.myftpupload.com
Stay In Touch