
The big “trick” with liquidity is trying to discern and work out “where” and “when.” A good deal of that is about liquidity as it actually exists; not what you see today but what it may look like tomorrow. That vital disparity can be nothing but havoc, especially when conditioned to look at correlations as something durable – which is the primary problem relying too much on statistics.
We are witnessing, I believe, just such a period now as what looked to be uncorrelated last year has suddenly become the opposite. If you believe that the “stock market” is in a bubble, as I do, then sustenance of that is leverage. Leverage takes many forms, a few of which are very visible (margin debt and especially stock repurchases tracing back to corporate debt). The financial carry is not; therefore the search for proxies.
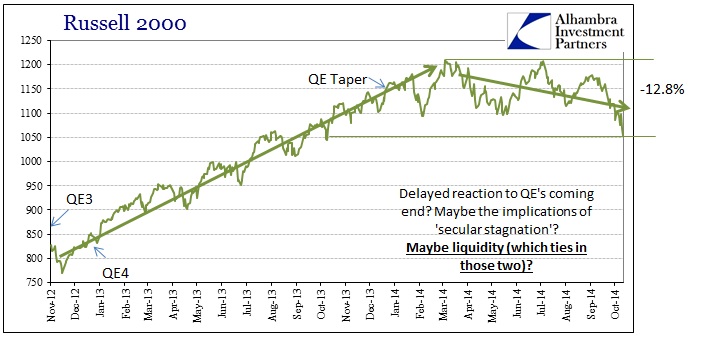
Taking the most noteworthy (at the moment) index, the Russell 2000, there was clearly an absence of any trace of 2013’s major market event. The global dollar tightening in the middle of last year is not to be found here. However, in a stark change this year, if you look at the most recent decline there is a direct tie with other liquidity and leverage proxies.
First and foremost, while the Russell’s extreme high dates back to March, the double peak occurred on July 3 (and was only half an index point below). That coincided with another peak seen in high yield debt.
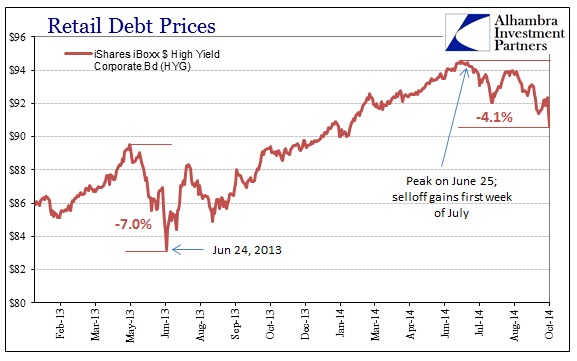
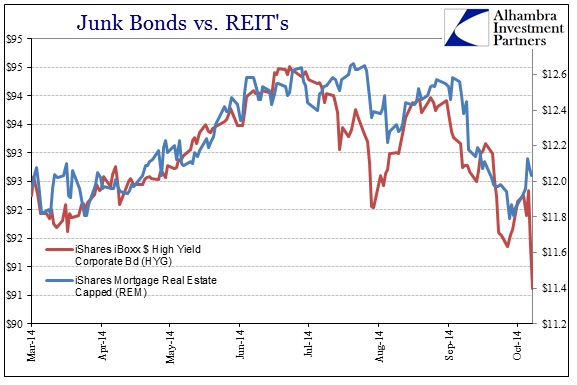
That a correlation exists between small cap stocks and high yield debt is entirely unsurprising except that there was none, again, last year during the tightening event. Where the Russell kept moving upward (outside of a very minor pause) high yield was hammered. Furthermore, working backward, the track of high yield debt and mortgage REIT’s has been very tight, meaning that any correlation there ties in with liquidity and leverage.
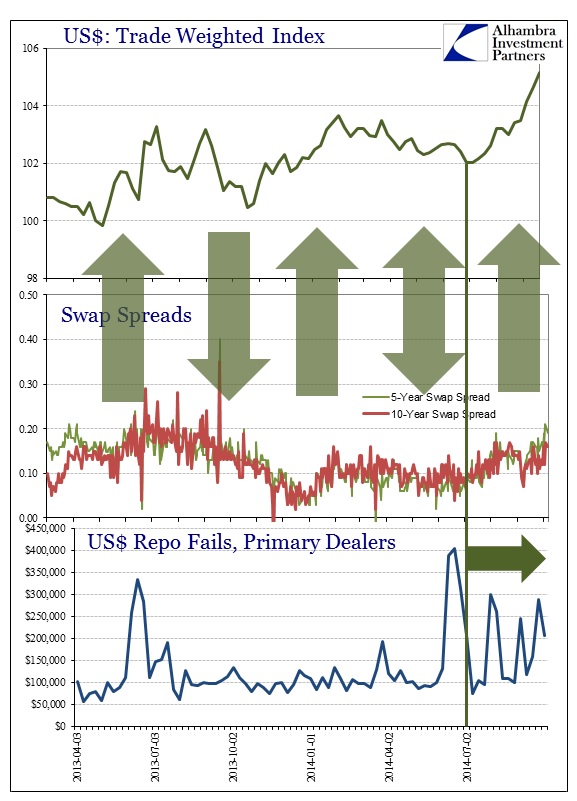
Since the timing of this change in market character all dates to early July, and all goes in the same direction, that brings in the most visible liquidity proxy – the “dollar.”
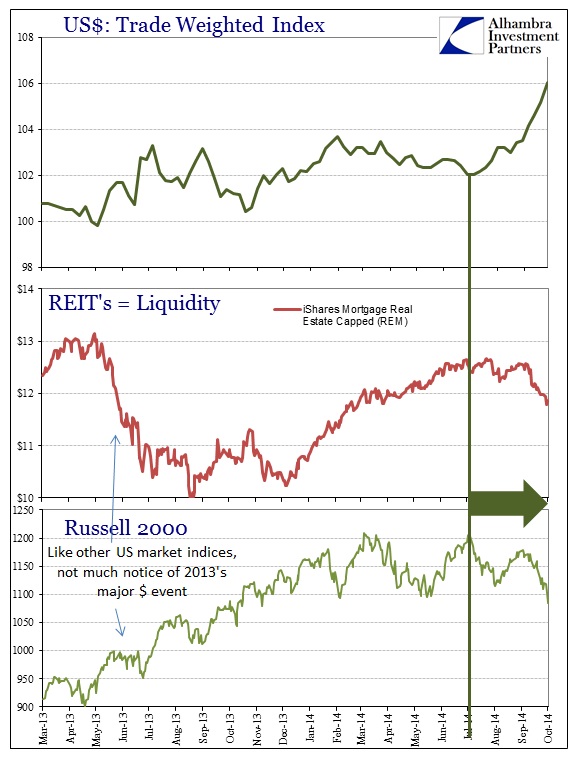
We now have a situation where the dollar starts its precipitous and disruptive “rise” (global dollar short problems) once again but this time apparently drawing in a US stock market segment (and maybe the broader “market” now). What changed between 2013 and 2014?
The obvious answer is QE, now on its last legs (of these iterations). That could work in terms of psychology, where leverage agents were purposefully ignoring 2013’s massive disruption under the warm blanket of Bernanke’s promise that was only being talked at. But there is a problem with that as a comprehensive narrative. Certainly the “taper” disruption would have had disturbed that idea just as it did for global $’s; that it didn’t suggests there is more to it than just a shift in QE on to off.
While I don’t want to totally dismiss the psychology aspect, indeed I think that is very important to understanding the bubble, there may be a more operational element here. I have been writing and speaking for some time about what looks to me like a very distinct diminishment in capacity for liquidity – most evident in repo.
The relation of dollar disruptions tends toward the most direct parts of the “dollar” “markets” first before eroding inward. Thus, if liquidity capacity is at least partly robust, then we might expect leverage unwinding to be limited there without too much spillover; in the case of 2013 to the leveraged credit markets, and foreign markets and currencies but not US stocks. That makes it appear as if the domestic US market, in stocks and certain credit, is completely separated from this “other” dollar, with such insulation itself (which is wrongly described repeatedly as the “cleanest dirty shirt”) offering an artificial reinforcement to the stock narrative.
However, if systemic liquidity had become even more strained in the passage of only a year (under QE’s harmful after effects, such as dealer capacity as it related to last year’s selloff upending the artificial allocation of financial resources), then it might make sense that various “markets” that were under little pressure in 2013 might now feel it now in 2014.
If that is actually the case, the correlations of last year (or, as it may relate to US stocks, the conspicuous lack of correlation) may no longer apply, or, at the very least, may apply in different proportions at different places. It is an intriguing possibility, and also very concerning. If there are psychology effects of QE now in reverse, a lack of systemic liquidity to maintain the bubble nature of the stock market might add to the layers of potential reversal.
With credit markets continuing to signal distress (with the 30-year UST now trading below 3%, and the 10-year UST under 2.30%) there will be a lot of pressure on the FOMC to “bail out” markets yet again. Maybe that is why the September FOMC meeting minutes sounded so “dovish” as it relates to the future track of QE and ZIRP. Again, funding markets apparently took that as a potential change in policy stance (though we are still in the knee-jerk phase).
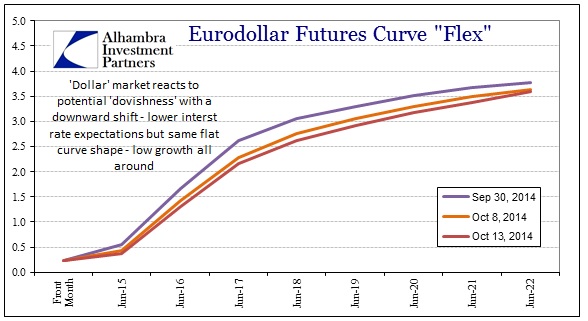
It was interesting to see that though eurodollars were quite taken with the idea of a less determined FOMC position on raising rates, that offered no shelter to either stocks or high yield debt (both sold off very hard Friday despite the eurodollar curve continuing to shift inward and flatter). That bears close observation in the days ahead, to see what other correlations may be breaking down or changing if systemic liquidity has indeed been devolved by so much heavy influence for so long.
Stay In Touch