
The Census Bureau is seemingly out to prove the point that monthly variations in home sales data are really meaningless. Downward revisions after last month’s curious “surge” in new home sales place the trend right back in the rut it has exhibited for a year and a half now. Given that single family home construction has likewise stagnated, the revisions are actually make far more sense than the initial data.
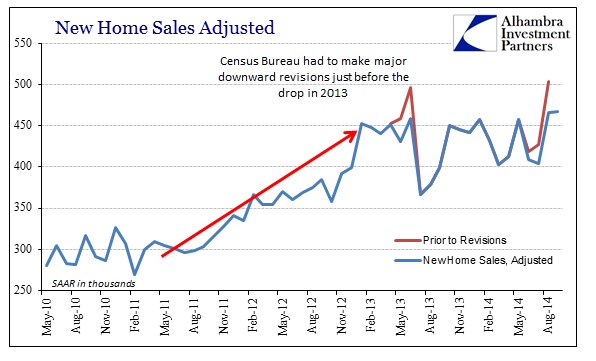
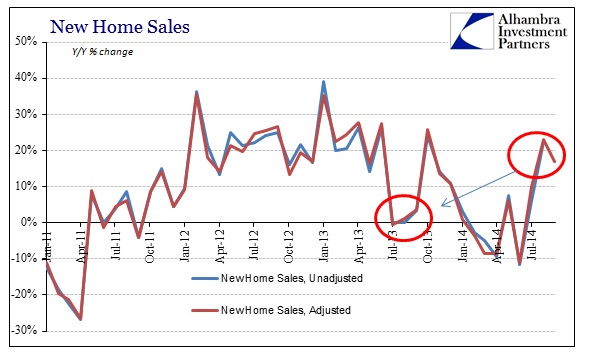
The last time new home sales were revised lower by a similar amount (and not just in one month) was prior to the last peak in the trend before “dollar tightening” disrupted the mortgage market in the middle of 2013. With that timing, the year-over-year comparisons are skewed by that base effect, meaning trend is, again, more important than variation.
As is to emphasize this point, a potential outlier in home prices was displayed though in the opposite direction – lower. While the median home price was revised upward in the past few months, it dropped sharply in September from $286k all the way to $259k.
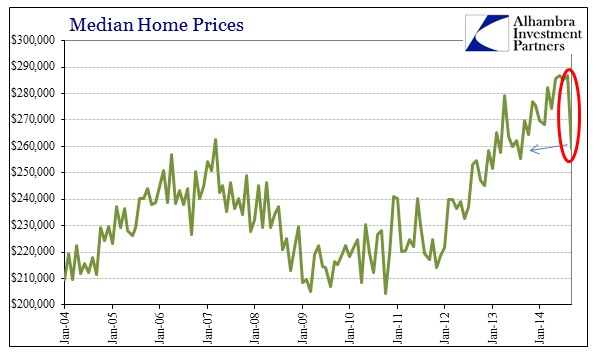
That may end up courting an upward revision in the coming months, but there is again the curious repetition in pattern as it relates to these kinds of results prior to that mid-2013 disruption I referred to above. That may be making too much of this, however, so it remains to be seen whether the pattern repeats again, or is revised away.
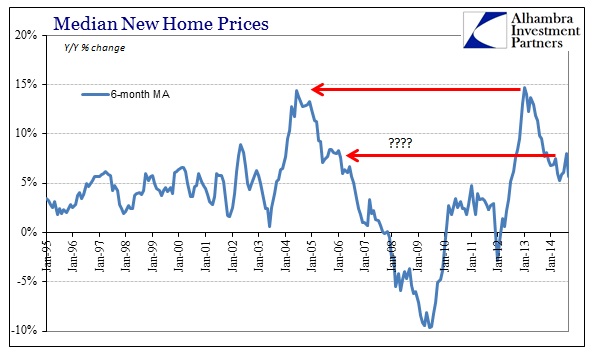
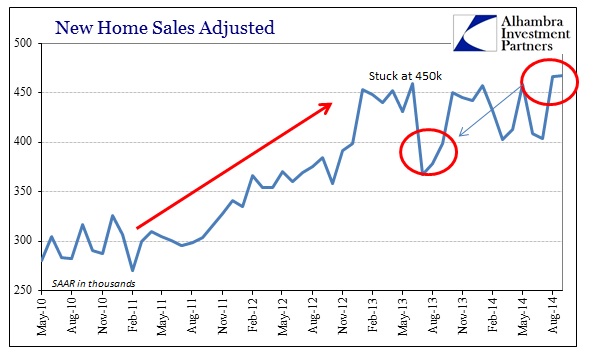
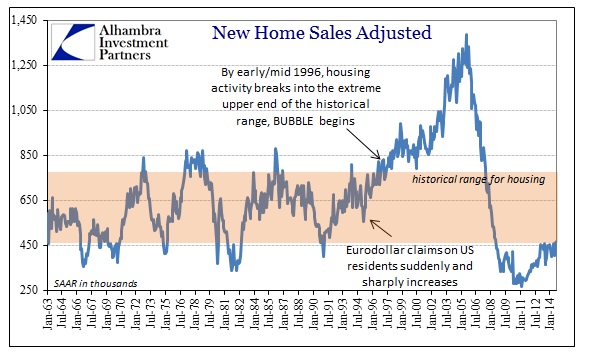
To that query, the behavior in prices since the mini-bubble in 2012 ended is starting to look a lot like the prior “cycle” (bubble) peak. So revisions here, or the lack of them, will be important clues as to further direction in both recent context and overall. Regardless of the variations, there is no denying just how far behind home sales (and thus construction and economic activity) remains. Being stuck at and around that 450k SAAR level keeps the housing industry persistently below the lower boundary of what would fairly be called the historical range.
In many ways, that highlights what looks to be a significant ceiling or limitation in how the housing market may progress, thus further emphasizing price action. I think the latest figures from the NAR on existing home sales may be confirming that idea, as home sales there have clearly lost momentum after rebounding only somewhat from the huge slide into the “winter.”
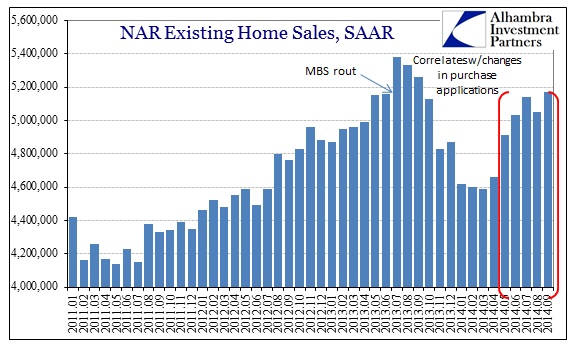
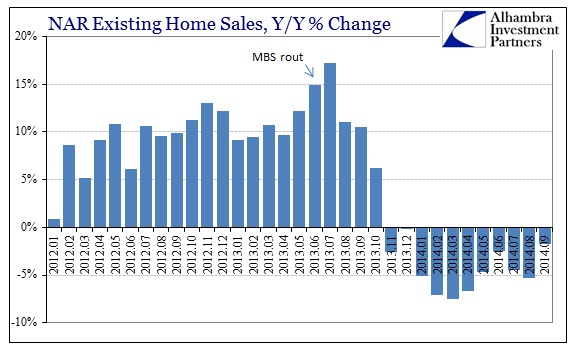
Despite more favorable comparisons now, home sales in September 2014 are still lower than September 2013.
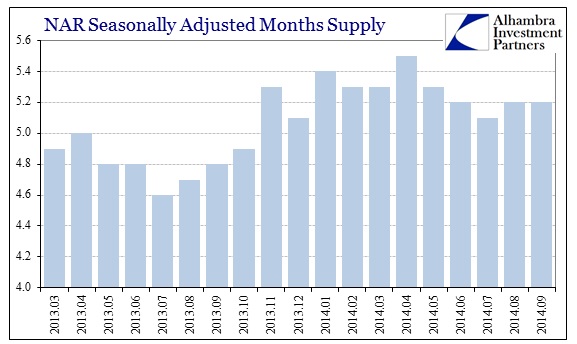
Despite the sales pace, inventory continues to be much higher now than a year ago. The total months supply of inventory in September 2013 was only 4.8, but now is steady at 5.2. That isn’t a huge increase but it does mark another potential “headwind” for housing momentum, especially prices, if the sales pace doesn’t actually pickup in months ahead.
While it is too early to tell at this point, there are a growing number of signals, if valid statistically, for another inflection in housing and real estate. That extends, of course, to home finance as indications from the big mortgage lenders are for another downturn in their pipeline (and not just refis) despite significantly lower mortgage rates this year overall.
Stay In Touch