
The unfortunately established narrative for all economic accounts in 2014 relates (still) to depressing winter earlier in the year and “better” from there. At first glance, the latest figures on durable goods seem to be following that idea, though a “rough patch” has perhaps developed over the past two months. A wider context, however, is really needed as the pattern really goes back beyond Winter 2014.
In fact, durable goods levels have been rising since the early part of 2013. While that would seem to be very good news for the larger “recovery” or acceleration narrative, the problem is that despite “better” numbers recently they still do not correspond with what would fairly be called sustained (and sustainable) growth. So, overall, durable goods are better than 2013 but not really close to the “fat” part of the business cycle.
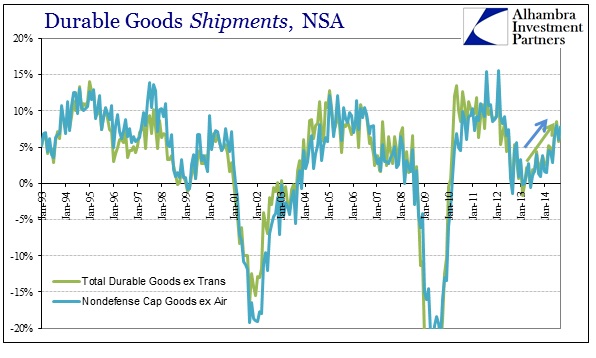
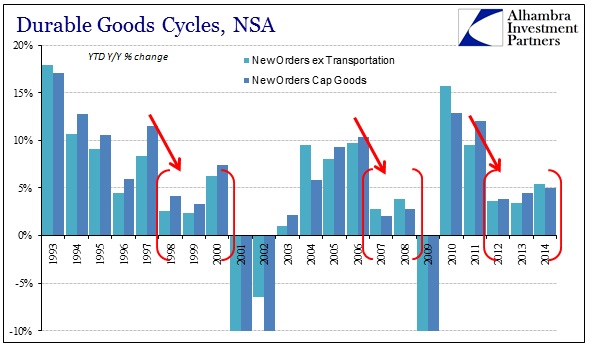
In fact, if we are comparing business cycle pieces, this deficient but upward trajectory has been seen at prior peaks. Growth periods in both prior cycles exhibited exactly this same kind of trend, whereby an established growth segment gives way to a clear and unambiguous slowdown (2012 vs. 2006 vs. 1998). Growth picks up after that dramatic decline, but never to really re-attain the prior groove.
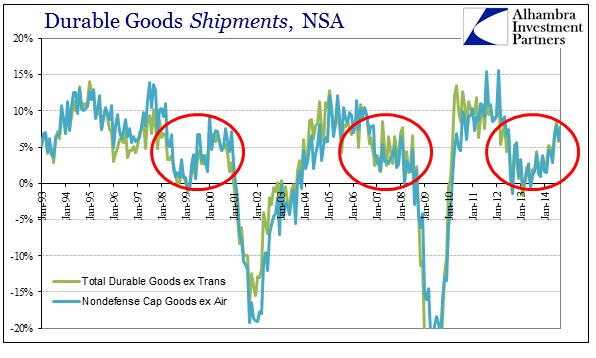
To me, that is one effect or alteration of the elongated cycles that have been evident since interest rate targeting has been implemented. What might have been a single and short inflection toward recession prior to 1990 now seemingly takes years to “turn.”
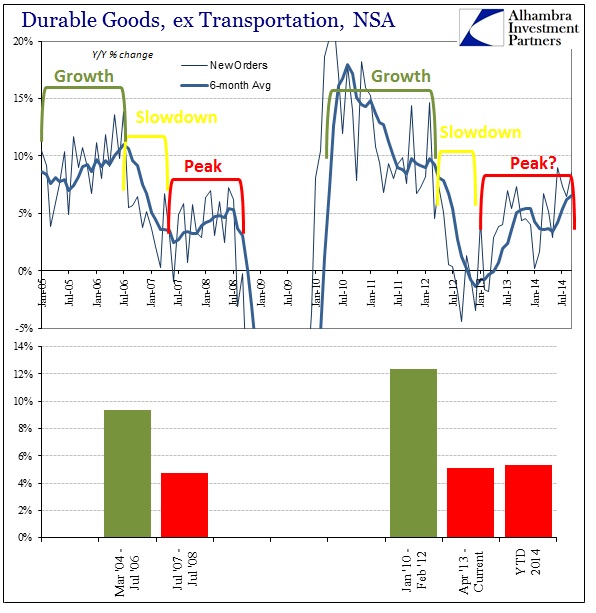
As is clear in the chart above, durable goods orders rebounded after the initial slowdown concurrent with the end of the housing cycle (bubble inflection). Rather than head straight into recession, the economy lingered in this “half-growth” state for more than two years before finally collapsing into the second piece of the Great Recession.
In this current “cycle”, the stages are even more pronounced (and perhaps even more elongated). The “growth” period immediately after the Great Recession was far quicker than the prior cycle, no doubt owing to the devastating scale of the collapse. Then in early 2012 it abruptly ended, with a slowdown that was far deeper than even the bursting of the great housing bubble in 2006. The economy has remained stuck in the “half-growth” period ever since, thus depressing any optimism toward 2014’s “improvement.”
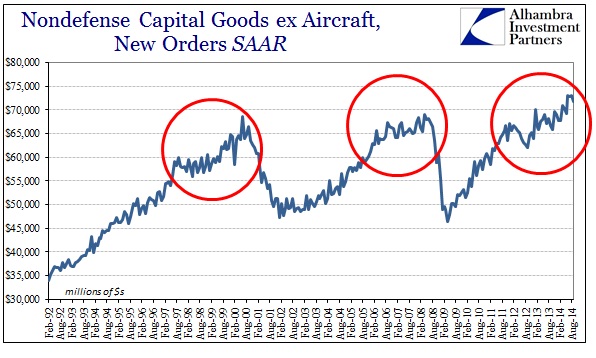
The primary deficiency of these elongated cycles only becomes evident with wider perspective. The mainstream focus on month-to-month variations (which may be nothing more than statistical noise) cannot comprehend why the economy so underperforms all expectations. Again, taking 2014 durable goods to be better than 2013 is not any standard by which to judge sufficiency.
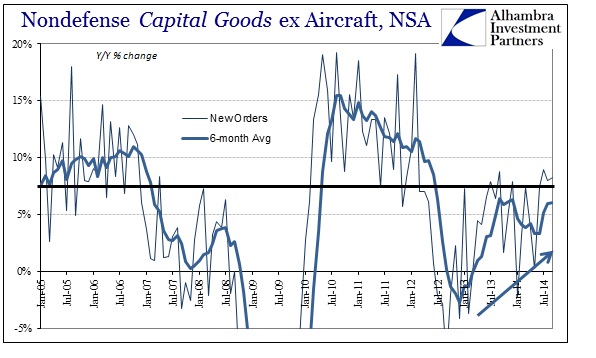
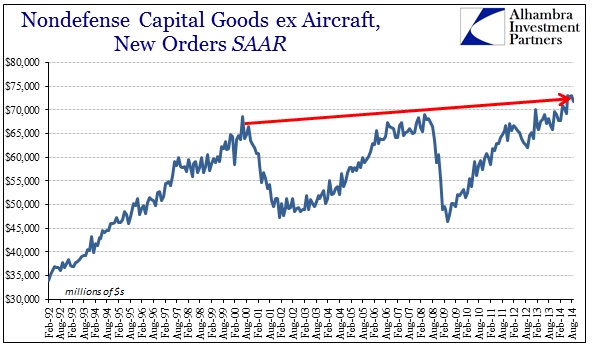
Looking at the chart immediately above what stands out is not just these elongated peaks in the cycles, but rather how little actual progress has been made. In fact, capital goods orders in September 2014 were only 7.9% above September 2000 – for a compound annual growth rate of 0.5%. In other words, there has been little change in capital goods for all of this century (with far more months existing below that “peak”).
Worse than that, this exhibits the now seemingly ubiquitous trend whereby these economic indications don’t even keep up with population expansion. To that point, if we scale capital goods orders by population measures the real deficiency in the economy is not just flat-lined growth, but less than the pace of population expansion.
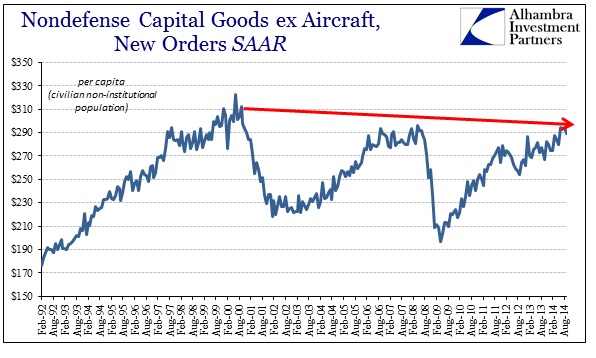
That by itself is not necessarily an economic disaster. After all, the US economy has undergone transformations before and is not necessarily to be predicated on manufacturing. However, if there is to be some kind of shift away from production of this kind there had better be something stable to absorb newly freed resources. In other words, if we are producing less proportionally of goods then there had better be a stable trend of new services to fill the hole.
Instead, what has taken the marginal slack in resources has been the disastrous trend of finance – the “mature” bubble age. Again, I go back to the elongated cycles that demonstrate not just this financialism creeping into a more dominant economic position but also the (mis)direction of actual economic (and financial) resources in places that were never going to be efficient outside of pure monetary influence (i.e., housing; redistribution through stock repurchases). Rather than create a beneficial countertrend against clearly lost manufacturing influence in the economy, monetarists have “filled” in that hole with the worst kind of shifting sands – the serial asset bubbles.
On both accounts, structural and cyclical, durable goods have come up vastly short of where they “should” be to be consistent with the conventional narrative. In cyclical terms, until durable goods are growing again consistently by double digits (and this is very much echoed by other indications like retail sales that seem to be “stuck” in “half-growth” peaking) there is nothing really to be optimistic toward the full expression of “recovery.” Structurally, to regain that lost economic trend would need growth not seen since the 1980s, which only places more pressure on the rest of the economy to take up not just this “slack”, but slack which is growing by proportion as growth here continues to underperform.
Given the state of wages and actual employment, it is very clear that this erosion is not being met by any actual economic gain elsewhere. Rather, the cycle simply repeats once more as monetary-driven factors are again dominant.
Stay In Touch