
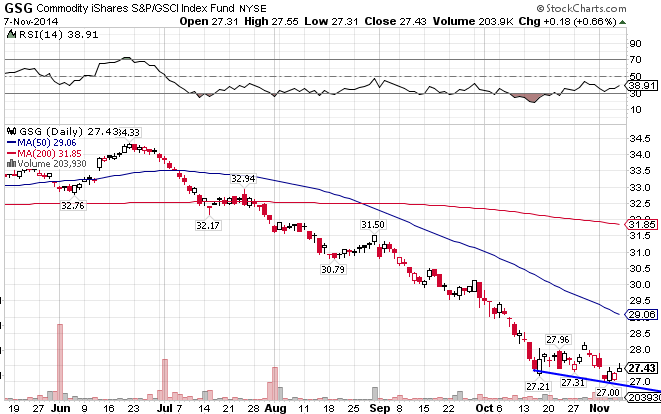
The GSCI Commodity Index ((GSG)) consists primarily of Energy, but also includes Agriculture, Industrial Metals, Livestock, and Precious Metals as part of its holdings. The index broke down during the month of July on the back of a stronger US Dollar. It failed a critical test once it broke through the 200-day moving average, and now is down for 14.79% year-to-date. Still trying to find a bottom.
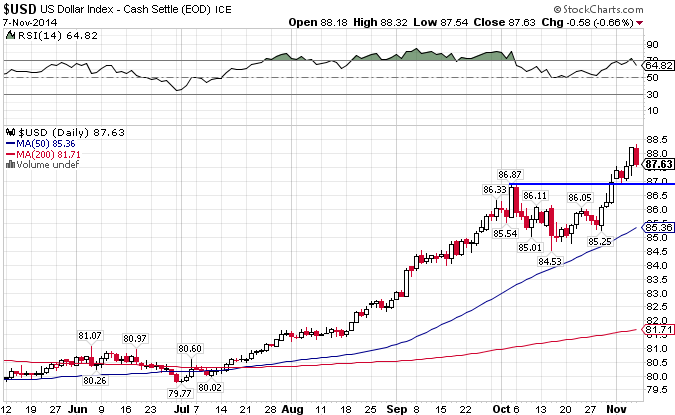
The US Dollar Index. Can it hold that 87 level?
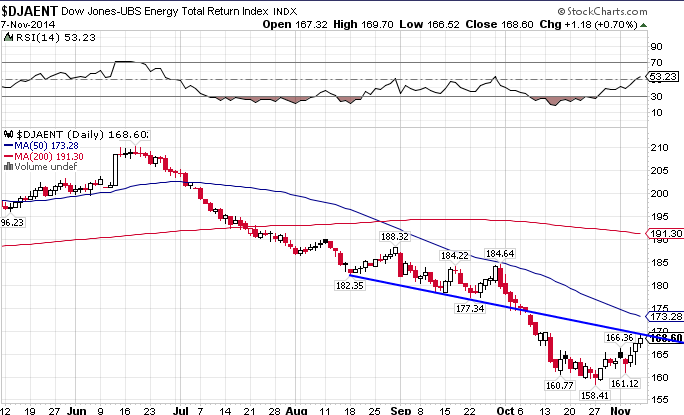
The Dow Jones-AIG Energy Index (JJE) consists of Natural Gas, Crude Oil, Heating Oil, and Unleaded Gas. Since the middle of June the index has been collapsing, breaking support at the 50 and then 200-day moving averages. And this despite serious issues in the Middle East. The index is now down 12.70% for the year.
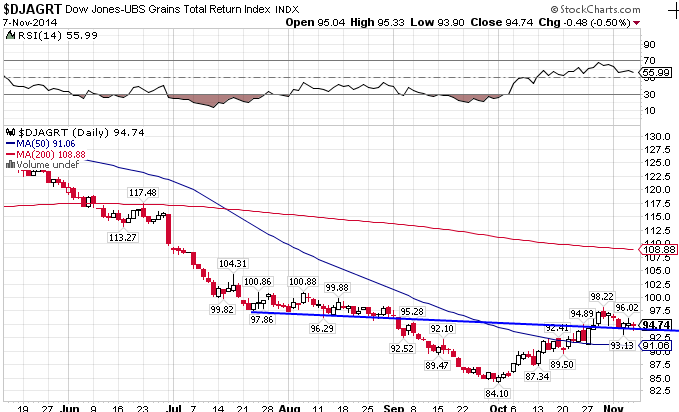
The DJ-AIG Grains Total Return Index ((JJG)) consists of Corn, Wheat, and Soybeans. The 1st Quarter of the year had been a spectacular one for the index, as it has blown through both moving averages on its way to a 16% gain. The index has since retreated back to its previous levels, plus much much more. It seems to have finally found a bottom though, crossing past the 50-day MA and holding support at the 94 level, so far. The index is down 14.28% so far in 2014.
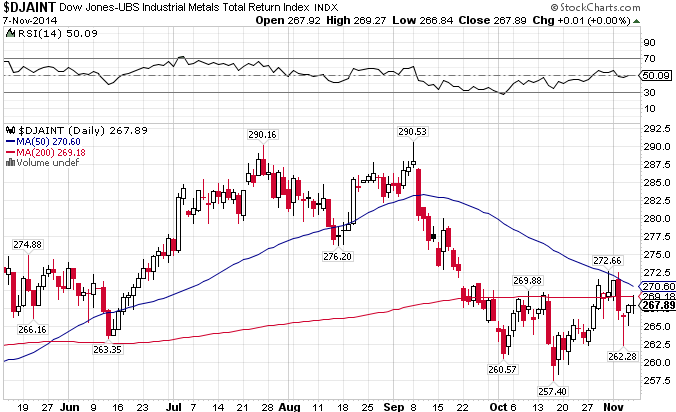
The DJ- AIG Industrial Metals Total Return Index ((JJM)) includes Aluminum, Copper, Nickel, and Zinc. JJM was one of the hardest hit by the weakening global picture in 2013, but is amazingly one of the few bright spots so far this year. JJM is only down 0.84% YTD.
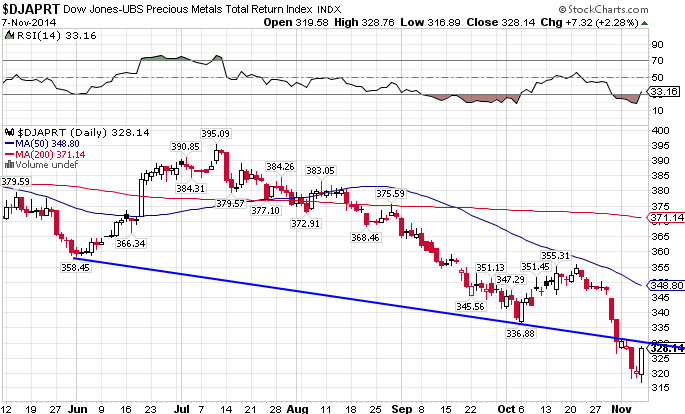
The DJ-AIG Precious Metals Index ((JJP)) includes Gold and Silver. The index broke through support at the 350 level to make new multi-year lows. We could be in for a continued ride lower though if the dollar continues to strengthen. JJP is down 9.88% YTD.
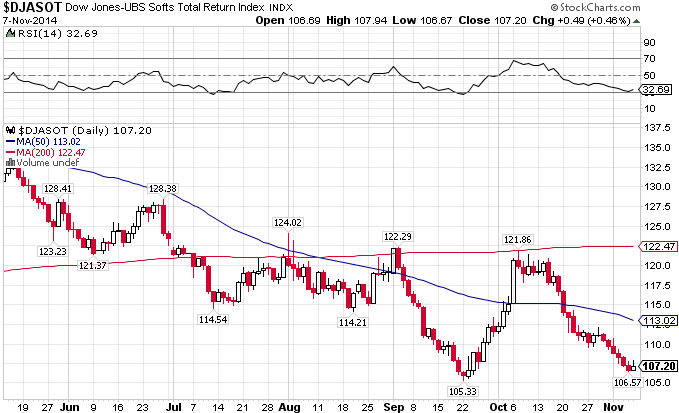
The DJ-AIG Softs Index ((JJS)) includes Coffee, Cotton, and Sugar. JJS was on an absolute tear in the 1st Quarter, up just under 30%. But since then it was come back down to earth, and must get above the 114 level if it wants to restart a positive trend line. The index is down 3.21% YTD.
Stay In Touch