
The nature of liquidity under the eurodollar standard is to essentially link “markets” that outwardly seem to have little or no relation. You can see the synchronized ups and downs quite clearly but miss the ultimate connection, especially under the orthodox assumption of the world’s economies and their “natural” finance as mostly closed systems with only tenuous associations.
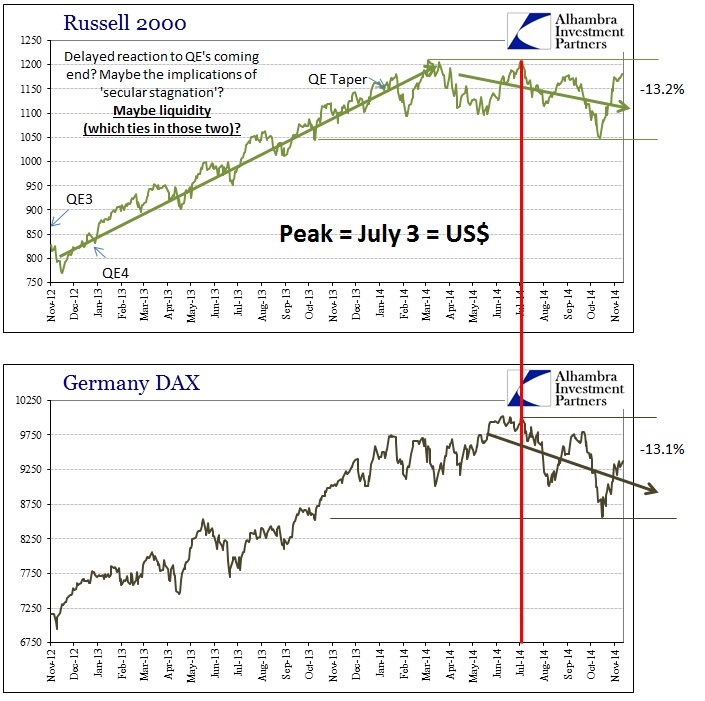
If that were really the case, then the very clearly correlated movements in 2014 between the Russell 2000 and Germany’s DAX, of all places, would make no sense whatsoever. That would be even more puzzling under the conventional narrative being driven by economists where the US is sailing in the “right” direction while Germany is not.
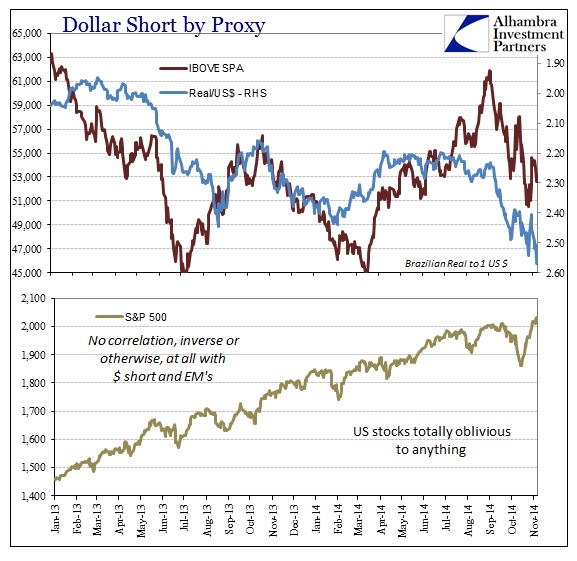
The interconnected nature of the global dollar short being evident, there remains at least one participant short of a fully encompassing regime. Thus liquidity seems to operate under separate rules and standards for at least big cap stocks in the US in contrast to the more leveraged small caps (and thus more susceptible to swings in liquidity).
However, that isn’t a fully accurate description, as the leverage and liquidity elements of, say, the Russell 2000 and the DAX relate to what are truly financial elements. The S&P 500 is itself undoubtedly buoyed by massive leverage, though it simply comes in a different format almost unattached to the same financial factors. That is why the dollar interruptions in 2013 and again in 2014 show no imprint on the S&P 500 or DJIA.
The most obvious effect of QE’s so far has been on corporate balance sheets. Despite all the chatter about record cash balances, and there is that, all that cash relates to prudent (relatively, of course) liquidity management as company debt levels have exploded (though a huge amount suddenly disappeared in the last update to the Flow of Funds accounts). As anyone paying attention well knows, corporations at the larger end of the scale have been using that debt (and a good proportion of internal resources too) to repurchase shares.
Corporate balance sheets, again especially the larger firms, are the QE pivot whereby “cheap” debt is turned directly into share prices. That is why (and not the only reason, but I surmise it to be the primary) the S&P 500 can move along on its merry way without regard to financial liquidity and “dollar turmoil.” There is no need for a more complicated or convoluted explanation, especially as this is exactly as then-Chairman Bernanke intended (he just expected that such a “wealth effect” would actually impact the real economy in a more positive manner rather than just the negative thrust of price instability).
The effect of more than a trillion and a half dollars in share repurchases is very clear as S&P helpfully details with their “buyback index.” This creation tracks share prices of the “top 100 stocks with the highest buyback ratios in the S&P 500.” There is absolutely nothing shocking about just how far it has outperformed the full index.
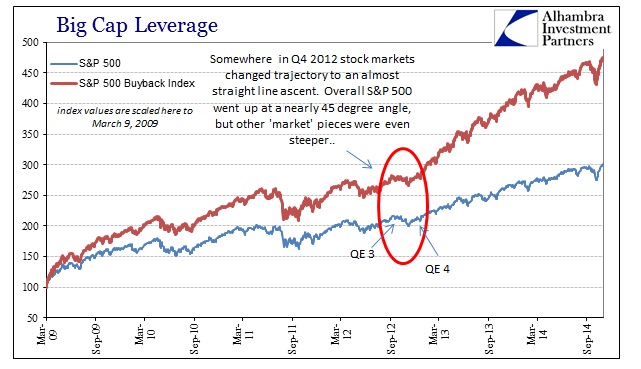
It is noteworthy, though, that such outperformance gained a very clear boost at the exact time QE3 and QE4 were announced and implemented. This is not to say that those inert “reserves” created as a byproduct of monetary policy “purchasing” have been finding their way directly to share prices, but rather that the impact on corporate balances sheets as the pivot to such asset inflation was that mechanism. What is left to the imagination is whether there is a direct price relationship with actual corporate purchases (which would make CFO’s among the worst of “dumb money”, which is how that greatly favorably impact to their own “pay” should be viewed) or whether it is just the psychology of investors viewing share repurchases as being a positive factor (including on EPS).
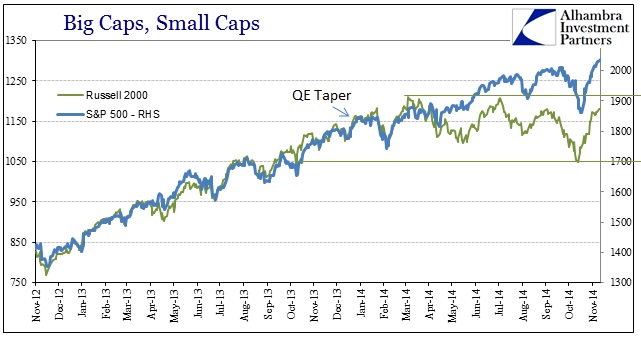
What is interesting aside from the clear boost to the S&P 500 by all those buybacks is that even the S&P Buyback Index has outperformed the Russell 2000 – and more importantly when those inflections occurred.
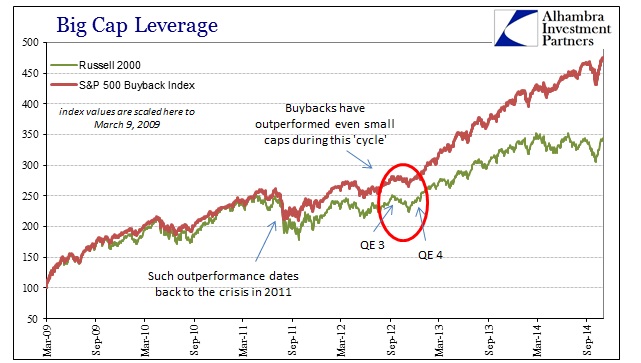
Until the flare-up of “dollar” crisis alongside the euro problem in 2011, the buyback index was step-for-step matched by the Russell. However, in that short and very sharp burst of a downturn in the summer of 2011, the Russell fared much worse and, relevant to our discussion here, never recovered its parallel position. That divergence was given an extra boost in Q4 2012 when QE3 and QE4 “pushed” investor complacency all over the place. That to me, again, suggests the difference in liquidity factors, especially going back to 2011.
In that respect, confirming previous intuition, leverage via buybacks is far more potent than financial leverage at least for stock prices – and far more sustaining where “dollar” liquidity has been tripped up.
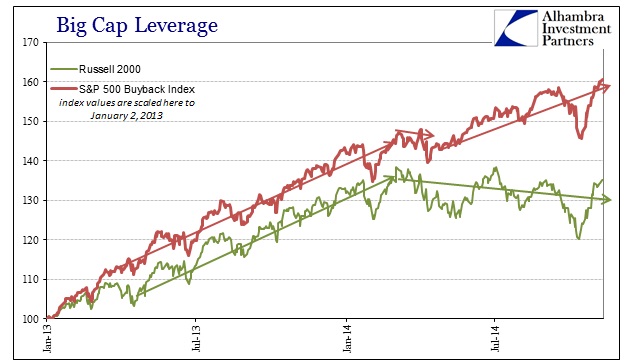
The trajectories in comparison in 2014 is revealing in that regard. The buyback index featured only a slight stumble around March and April before resuming its nearly 45-degree ascent; whereas the Russell 2000 has yet to revisit its early March peak (coming within a point on July 3rd, just as the “dollar” began to roil financial liquidity).
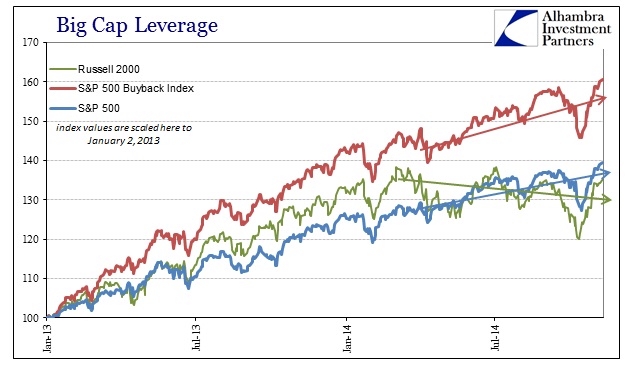
What we can only infer from that is how much the overall S&P 500 (and other big cap indications) is artificially transformed by this version of QE-driven corporate financialism. The index would undoubtedly be much lower without that huge infusion of leverage, and I think further that its track in 2014 would be more like the Russell.
That brings up the “issue” of 2013: why didn’t even the Russell 2000 fall off where other global markets impacted by the “dollar” travails surely did? I have little doubt that related to leverage under “safe” assumptions. In other words, in 2013 leverage that unwound did so in those “markets” and asset classes that were perceived as the most vulnerable – emerging markets judged as very susceptible as their economies were clearly undergoing negative shifts. US stocks in 2013 were not viewed by the majority (the power of “the narrative”) as in that position, therefore leverage, even financial, remained undisturbed by 2013’s credit market jolt.
That, then, really emphasizes the potential shift in economic outlook in 2014 for even the US – not just in terms of “global growth.” Small cap stocks are more prone to macro factors, so it is very interesting, especially given the pretty big “hole” in earnings for small caps this year, that financial leverage is eroding in emerging markets and developed economy stocks alike. This year, there does not seem to be as much economic “discretion” about the US economy or Germany or Brazil. Those factors would also link not just the presence of dollar liquidity in the eurodollar standard, but also what may be driving the conception toward less risk.
The net effect is to leave the S&P 500 and other big caps standing alone as outliers against the turning (turned?) tide. That would suggest QE’s role as the last bastion of asset inflation still holding out against the much larger repositioning in wholesale funding and even corporate US credit (decompressed, on average, junk spreads). In what has to be almost counterintuitive given conventional expectations of small caps being “riskiest”, it seems as if the performance of the buyback index indicates otherwise (and nobody can rationally advance the argument that CFO’s are buying “undervalued” shares without explaining why they eschewed repurchases almost totally in 2009 after being “all in” at the top in 2007).
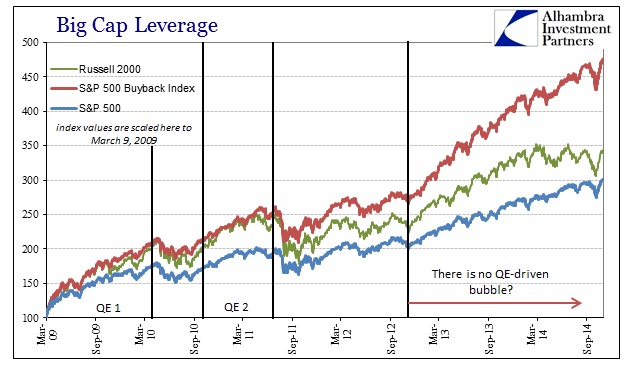
In other words, QE = bubble to varying degrees.
Stay In Touch