
There is still a lot of what I think is misleading commentary about a couple of very important topics recently. In Europe, there is an overdrive by the ECB to get banks to lend to people and small businesses. That may be an ocean away with a currency difference in between even that, but what the ECB is doing is very much related to the UST anomaly of October 15 that was far broader than just UST; about which there still seems far too much reluctance to accept that it was caused by the deficient systemic “rebuild” after 2009.
To arrive at two seemingly unrelated places simultaneously requires going back to the moment that they were visibly intertwined. To start there we can use the Federal Reserve’s own academic literature to illustrate better what has changed post-crisis.
In July 2009, the Fed published a paper titled Why Are Banks Holding So Many Reserves? The purpose of the essay was to calm fears of runaway inflation taking hold after QE1 began vastly expanding the central bank’s balance sheet. The idea that captured so many uninitiated observers was ostensibly the parallel surge in “reserves” to which banks would, as these mistaken beliefs held, suddenly and sharply lend them out to the broader economy (given some unspecified trigger). Such a spiral was believed to create inflation on par with the worst of the 1970’s – if not even further toward the doomish imagination (Weimar).
It is not often that I agree with the academic economists at the Fed, but in this instance they largely got it right. I say “largely” only because there is a lot they left out which is actually important to where we are now, but for their purposes it accomplished their intent.
NOTE: Figures below noted by “1-“ are taken directly from the Fed paper; all other designations are my own calculations beyond the academic setup.
The stylized basis for comparison is a two-bank system where each bank offers different comparative advantages. The authors don’t specify the difference, but it is clear that Bank A is a traditional depository institution and Bank B is an investment bank-type more akin to shadow function. In this starting example, Bank A finds it can lend $50 profitably but that it are more profitable opportunities to lend $40 to Bank B since Bank B can “invest” in a range of options beyond Bank A’s abilities. The basic regulatory assumption is a 10% deposit/reserve ratio.
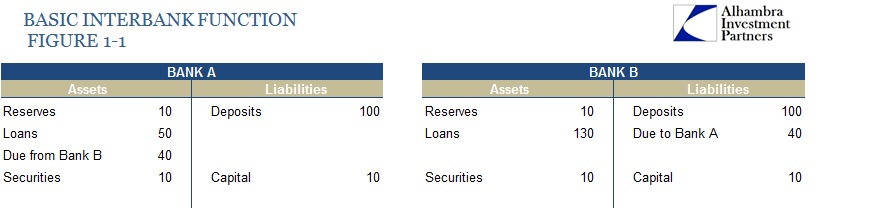
The interbank “market” in this simplistic example is represented by Bank A’s asset “Due from Bank B” and Bank B’s liability “Due to Bank A.” That is an important conception that doesn’t get enough treatment in most commentary, that “money” is someone else’s liability and not “property” (as in gold) in the modern setup. In that respect, “reserves” aren’t really that, as we shall see below.
The August 2007 eruption of crisis then is simply in the interbank “market” loan from Bank A to Bank B, which is also an expression of Bank B being caught in a synthetic short dollar position. As Bank A grew wary of Bank B’s activities in shadowed places, the likelihood of Bank A calling that loan grows. In anticipation, Bank B has limited options, but the first is to stop lending and buying up more securities – the credit crunch begins.
At the moment Bank A reaches its limit and does call the loan, Bank B can only sell illiquid loans (which the paper uses that classification broadly; in reality the security in question was MBS “securities” which are transformed “loan” pools). The resulting fire sale of Bank B assets to satisfy that “short” position is catastrophic toward systemic prices of everything else. To prevent that situation, enter the friendly, neighborhood central bank.
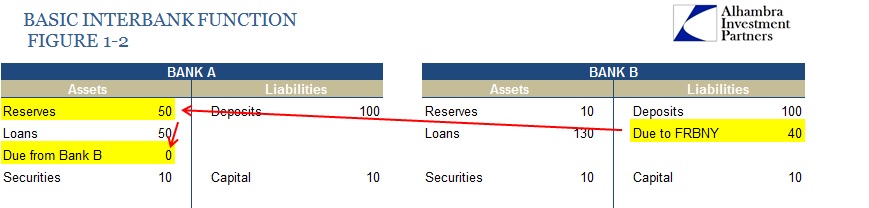
To alleviate Bank B’s short pressure, the Fed, operating through its NYC branch, essentially took over Bank A’s interbank loan. The net effects of doing so are highlighted above, as Bank B’s liability changes to a loan from FRBNY while Bank A’s assets reflect an increase in cash “reserves.”
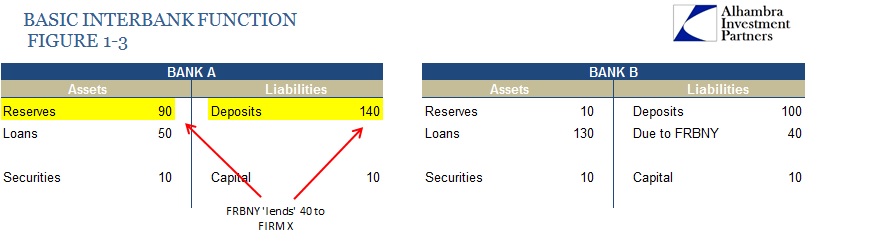
To complete the QE picture, the paper assumes a further loan from FRBNY to Firm X, who maintains a deposit account at Bank A. Deposit liabilities rise by $40 at Bank A, matched by a $40 increase in “reserves.”
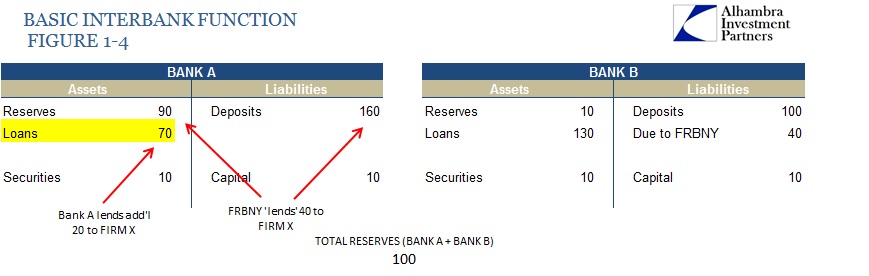
Apparently bolstered by such liquidity measures from the central bank, Bank A makes a further loan to Firm X (which is what the runaway inflationists were afraid of). Total systemic reserves have risen to $100 (Bank A + Bank B), five times the original position.
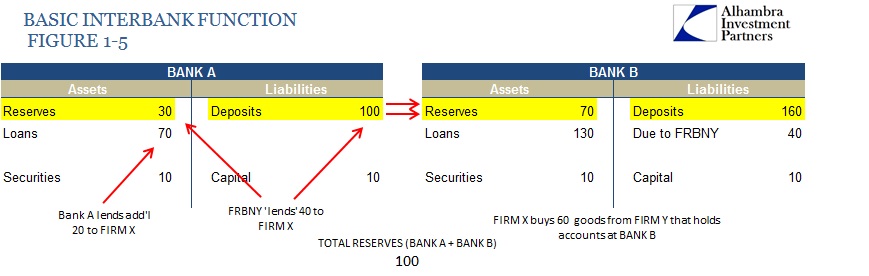
Finally, it is assumed that Firm X uses $60 to purchase goods and services from Firm Y, and that Firm Y holds deposit accounts at Bank B. So $60 is debited from Bank A’s reserves with a linked $60 decline in its deposit liabilities, while Bank B’s reserves rise by the same $60 with its attendant increase in deposit liabilities of the exact same amount.
The conclusion, which is very much accurate to the paper’s narrow point, is stated:
The general idea here should be clear: while an individual bank may be able to decrease the level of reserves it holds by lending to firms and/or households, the same is not true of the banking system as a whole. No matter how many times the funds are lent out by the banks, used for purchases, etc., total reserves in the banking system do not change. The quantity of reserves is determined almost entirely by the central bank’s actions, and in no way reflect the lending behavior of banks.” [emphasis in original]
Thus, what the central bank does in QE is to create a “byproduct” of peculiar finance, and ultimately it is up to banks to generate activity. While the paper ends there, there are actually other factors that made “inflation” as a matter of direct finance impossible (or nearly so given the conditions).
While that simple example provided by the paper provides, as I said, a useful starting point, there are additional complexities that need to be addressed. The modern banking system, especially in the Bank B “side” of shadow and investment banking, is never really limited by the quantity of “reserves”, instead governed by various mathematic functions.
Furthermore, the Fed’s function via QE is not quite what it appears in the simple example. In other words, there is a significant character change between pre-crisis and post-crisis as a direct result of what the Fed did.
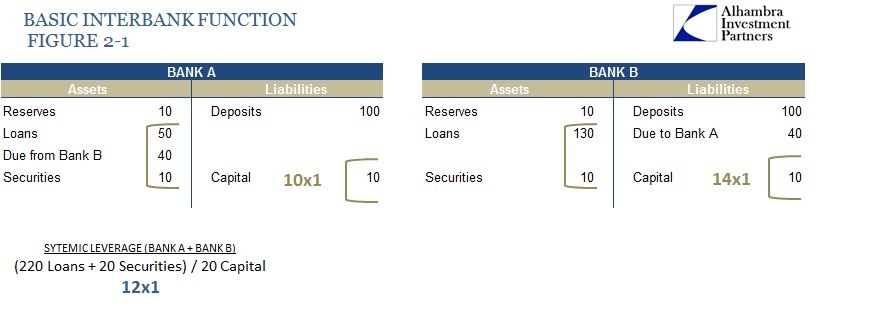
If we go back to Figure 1-1 and restate the relative position of the whole banking system in terms of not reserves but leverage, the systemic leverage starts at 12×1. Moving forward to the Fed’s QE-type “rescue”, systemic leverage has actually shifted significantly (this is Figure 1-2 restated):
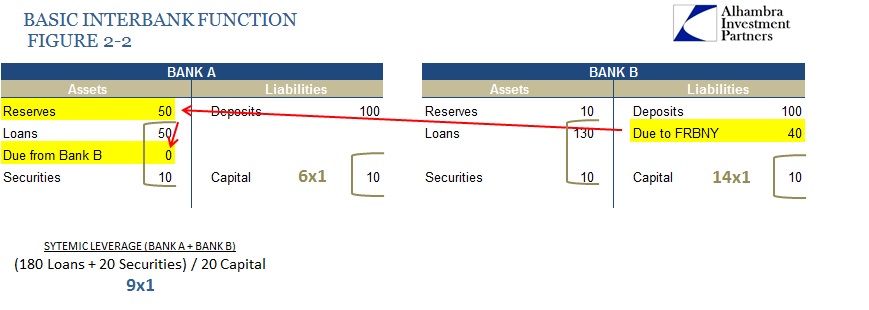
By essentially taking over the interbank market, the amount of leverage in the system has been greatly reduced but only in appearnce. In effect, the Federal Reserve took over not just the interbank market but also the role of marginal supplier of financial leverage to the rest of the global dollar world (private leverage declined as “public” leverage expanded). But that isn’t even the most important aspect of this, though it should always be in mind when viewing the post-crisis period.
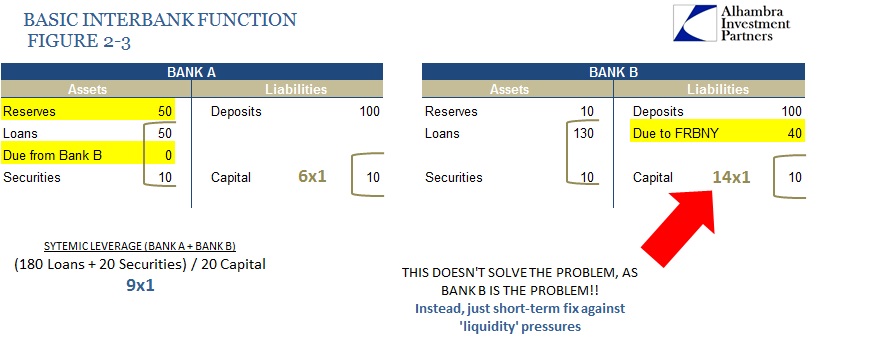
As a form of crisis management, all that did was alleviate any pressure arising from Bank A’s reluctance to supply leverage on its own. That did nothing to actually address the primary problem which was Bank B’s activities. Bank A deleveraged which, in effect, actually made the problem worse because there is a world of difference between freely supplied private leverage and that coming from the rigid, bureaucratic (and so often mistaken) FRBNY/Open Market Desk apparatus. Thus market prices continued to suffer because the Fed, in essence, performed a leverage transformation that was incomplete, if not totally ill-suited. In a two-bank system it does not matter; in the complex reality of modern finance it resulted in durable fragmentation (all over the globe, based on size, geography and plain old emotion).
And so the system crashed. What came after was dealing with Bank B’s problems. Some of that was addressed by further QE-type measures, but largely once illiquidity ran its course the Bank B’s of the world were still precariously situated, mostly because governance was, again, math-driven not “reserve”-driven.
Part 2 is here.
Stay In Touch