
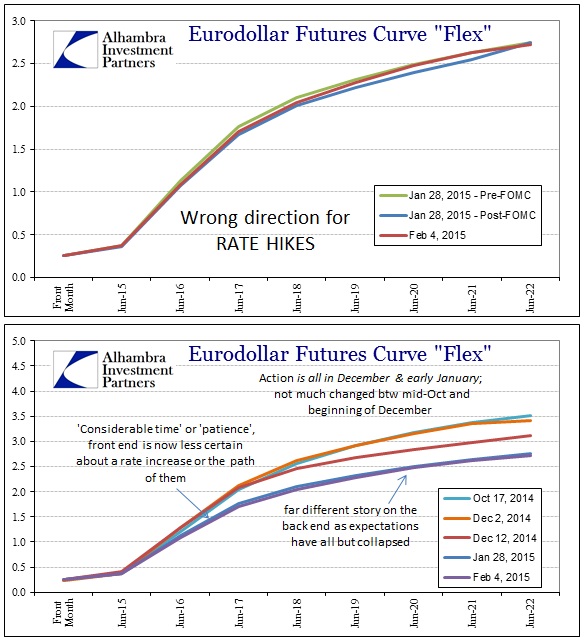
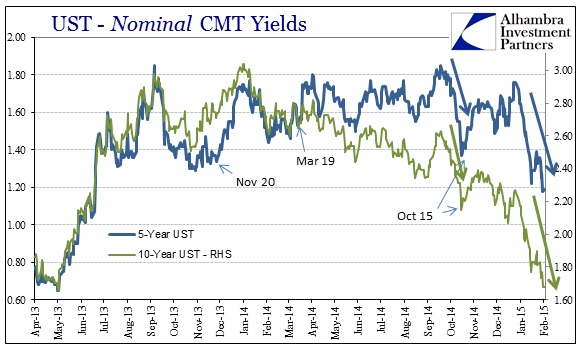
Oh Europe. I have a growing sense that US credit markets are repeating the leadup to last October 15, though there isn’t any obvious expression of any such illiquidity (at the moment). For one thing, the eurodollar curve has taken the FOMC’s bluffs in complete stride, in fact doing the exact opposite as you would expect of a very close change off ZIRP. That was evident last week when at the release of the latest policy statement investors bought eurodollars everywhere instead of selling the curve. A week later and the curve remains in such a state.
Again, the only two interpretations are that funding markets are convinced that the economy is already in a worse state or that the Fed will make it so by following through with its threats. The beginning of the bearish trend in credit started with a funding anomaly back on November 20, 2013, a state of illiquidity that was eventually repeated and hugely amplified on October 15, 2014.
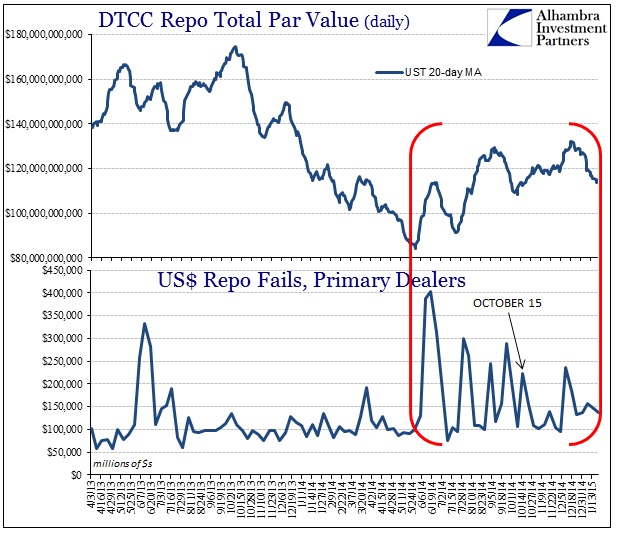
Trading in US treasuries leading up to October 15 showed a massive and “unnatural” rush to obtain as many securities as possible, and in every tenor outside of practically 2-years (even though nominal 2-year yields fell as well). These inner tendencies have been repeated yet again, beginning December 1 but also re-appearing just recently.
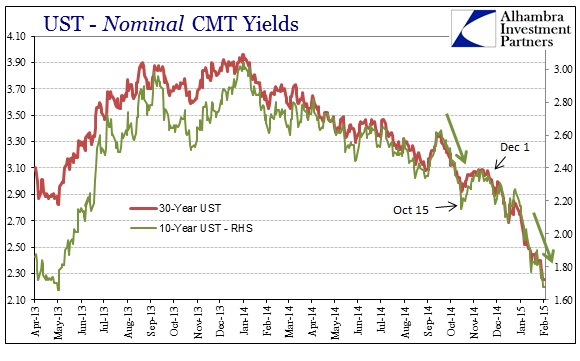
The resulting treasury curve shape has been a very curious but uniform flatness extending all the way down to the 2-year maturity.
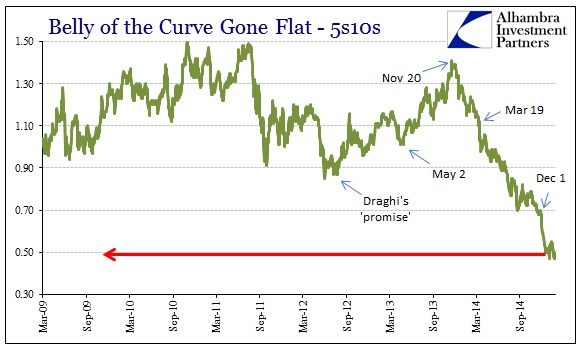
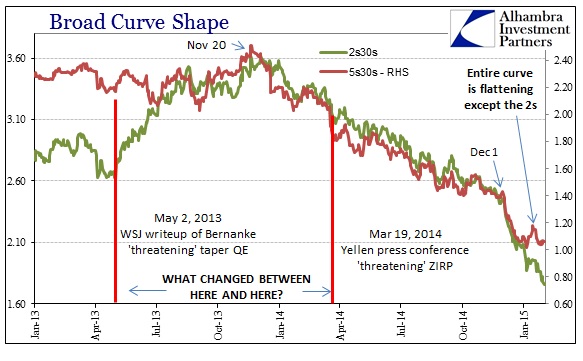
That would seem to suggest the FOMC’s threat upon ZIRP remains somewhat potent, but not more so, in the cash treasury market in contrast to funding markets. You would expect then that swap spreads would at least resemble funding market perceptions, which should lead to compression in spreads as the probability of rate increases (or their longevity) is much diminished despite all official noise.
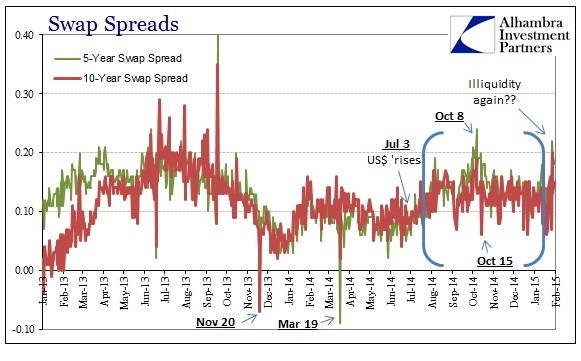
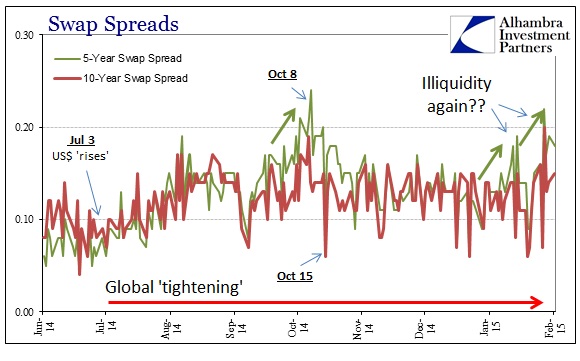
Instead, swap spreads have “surged” toward and above 20 bps in a manner not unlike trading results that immediately preceded October 15. Interest rate swaps are not just indications of interest rate perceptions, they are intricately linked to dealer activities, most especially the inner workings of credit “plumbing.” Thus derivative prices are often a derivative of liquidity pressures as well as more fundamental factors. That is, swap spreads may (I would argue more often) reflect dealer capacities as much as investor outlook.
There is elevated strain still in repo markets, though nothing like that of last June. Repo fails have never really settled down to the trading activity seen prior to the “dollar” tightening.
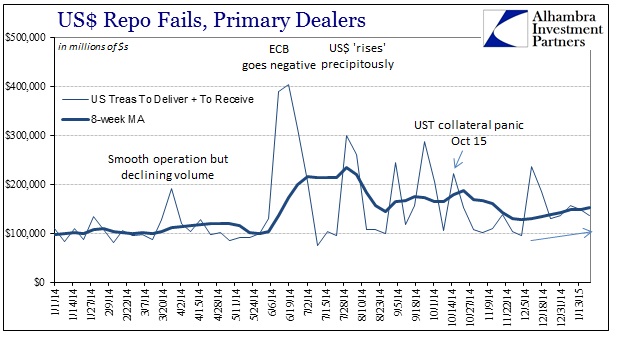
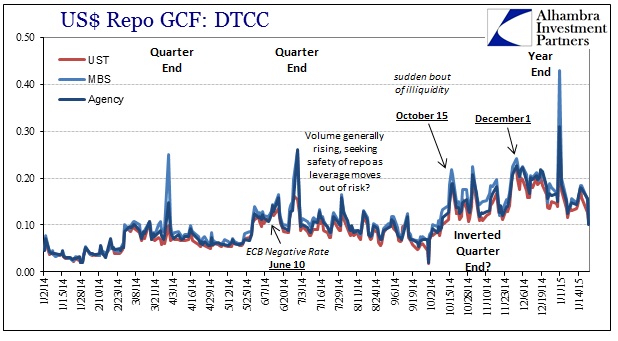
That would suggest, strongly, funding markets remain relatively “tight” and that dealer activities would echo that. In fact, repo rates have risen almost astonishingly high (these are GCF rates, and do not factor “specialness” like fails) throughout. The fact that repo rates remain elevated and close to that 0.25% IOER rate would seem to indicate robust demand for funding – and nothing yet to alleviate the supply side.
So the idea that there would be a baseline of relative illiquidity in funding markets is not in any way out of line with observations further downstream in credit; except for the distinct lack of outlet. Typically, as we saw in early October, there are impacts in asset prices as illiquidity gains wider disruption. That hasn’t happened, and certainly not to anywhere near October, in a broad pattern aside from a few problem areas here and there (China’s “dollars”, for one).
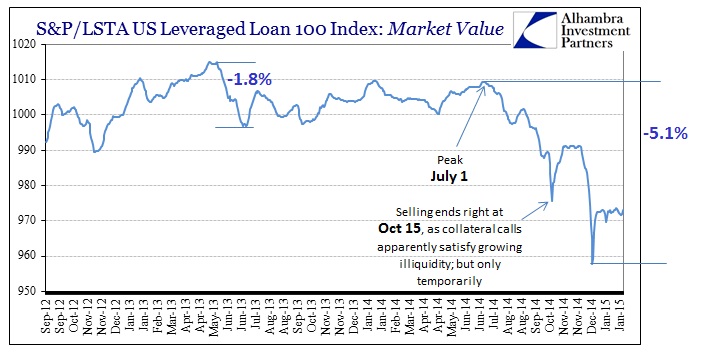
In fact, US credit, particularly high yield/junk, is nothing like the distress from that earlier episode. Junk spreads are still rising, but slowly, and nominal yields are still falling – indicating a steady bid. Even leveraged loans have maintained as much, though at a still reduced price compared to pre-tightening.
It remains possible that the far less visible parts of these riskier credit spaces are faring worse than indicated by the proxy here, but I think that would be apparent at least somewhere. If funding markets and dealers are perturbed to some degree, there isn’t an obvious answer to where it is being offloaded.
Of course, you have to realize that a full part of the dealer system, especially in “dollars”, lies outside the United States. European banks are proportionally as active, if not more so, still in “dollars” as are American banks. Given that fact, I have to wonder if illiquidity is starting this time (and maybe last time) with European participation as disrupted by everything going on in Europe at the moment. That would include not just QE and Greek drama, but also Swiss recognition of a massive “dollar” problem via removal of the peg – a problem that hasn’t yet been resolved as the franc’s continued unrest suggests.
The action in US treasuries and in swaps suggests liquidity capacity impairment to an even greater degree recently. Could that be, especially December 1 onward, troubled Swiss participation, or, more specifically, lack of? Might it relate to the return of geographic “dollar” fragmentation akin to August 2007, September 2008 and September 2011? Without any real trading in LIBOR (unsecured spot eurodollars) there won’t be any obvious trouble shown there, but my gut sense, if nothing else, is that there is a European “flavor” to this latest leg in funding irregularities – if only by process of elimination.
Maybe nothing comes out of all this and it is just shifting capacity and attention. Recent history suggests other possibilities. Oh the eurodollar world.
Stay In Touch