
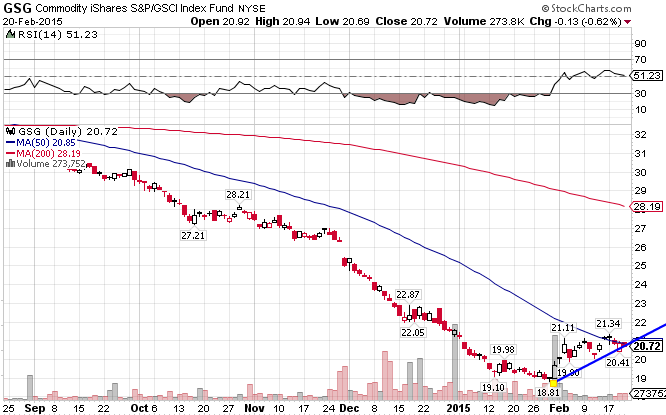
The GSCI Commodity Index ((GSG)) consists primarily of Energy, but also includes Agriculture, Industrial Metals, Livestock, and Precious Metals as part of its holdings. The index broke down during the month of July on the backs of a stronger US Dollar and Saudia Arabia’s strategic decision to hold production levels. It now finds itself just under the 50-day moving average after a deadcat bounce, and now is down for 3.99% year-to-date, in addition to being down 35% in 2014. Still trying to find a bottom.
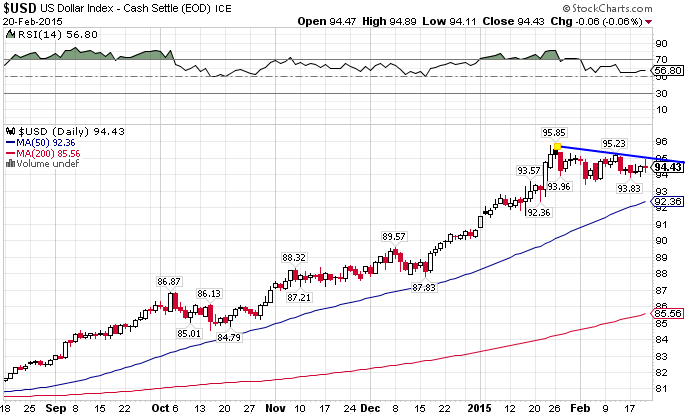
The US Dollar Index. Hasn’t had so much as a hiccup since July.
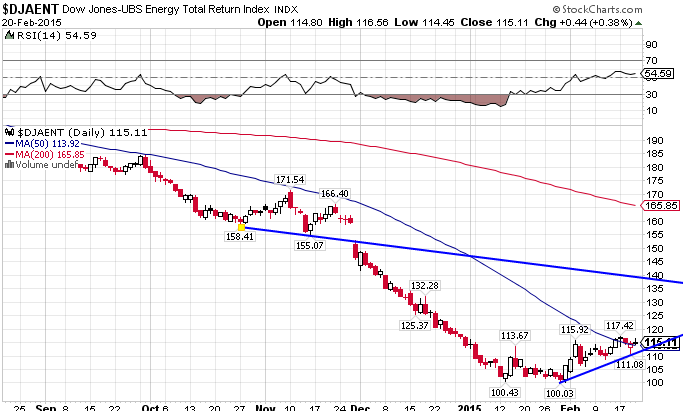
The Dow Jones-AIG Energy Index (JJE) consists of Natural Gas, Crude Oil, Heating Oil, and Unleaded Gas. Since the middle of June the index has been collapsing, breaking support at the 50 and then 200-day moving averages. And this despite serious geopolitical issues in the Middle East. The index is surprisingly up 1.97% YTD, after a 44% drop for all of 2014.
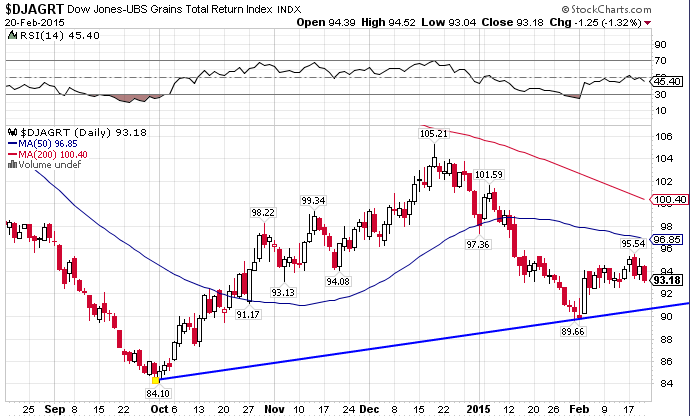
The DJ-AIG Grains Total Return Index ((JJG)) consists of Corn, Wheat, and Soybeans. Compared to all other commodity indices, it seems to have finally found a bottom, despite crossing under the 50-day MA. The index is down 6.14% for all of 2015.
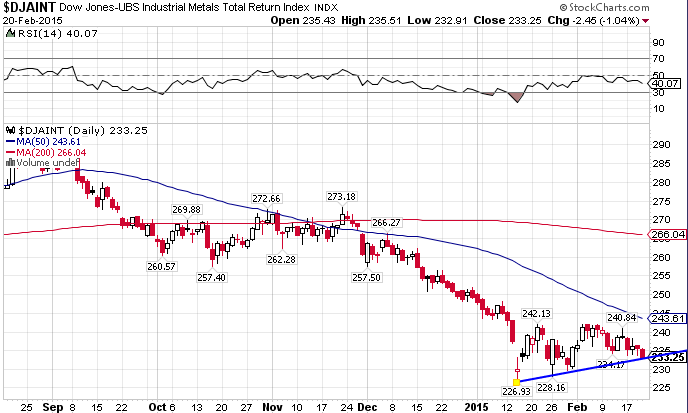
The DJ- AIG Industrial Metals Total Return Index ((JJM)) includes Aluminum, Copper, Nickel, and Zinc. The index has suffered along with most commodity indices, as global demand has been subpar. JJM is down 6.36% YTD.
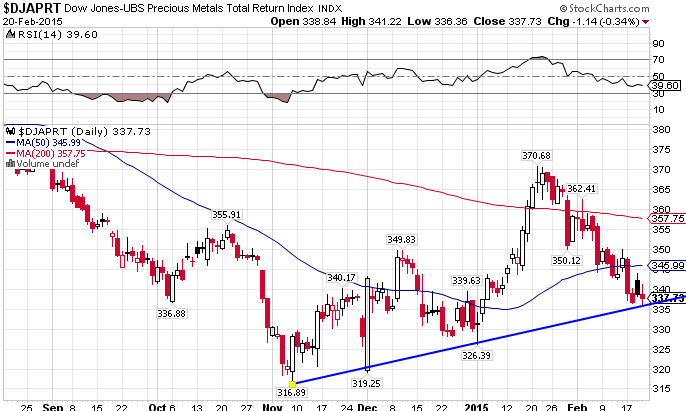
The DJ-AIG Precious Metals Index ((JJP)) includes Gold and Silver. The index broke through support at the 50-day moving average, but currently finds itself right at support at the 335 level. Despite a strengthening dollar, the precious metals index is impressively holding its own. JJP is up 1.28% YTD.
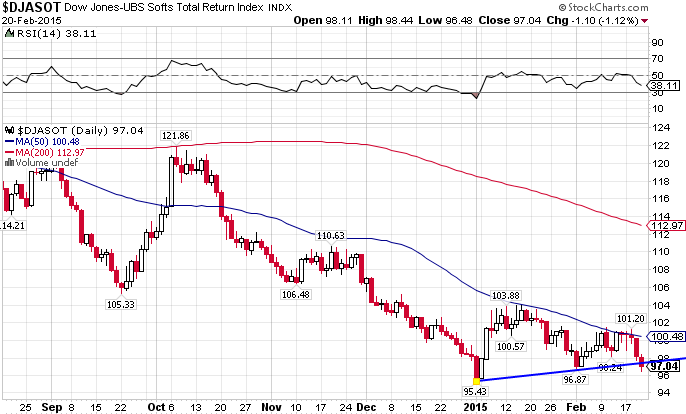
The DJ-AIG Softs Index ((JJS)) includes Coffee, Cotton, and Sugar. JJS was on an absolute tear in the 1st Quarter 2014, up just under 30%. But since then it was come crashing back, and must get above the 100 level if it wants to restart a positive trend line. The index is down 1% YTD.
Stay In Touch