
Lost amid last week’s stock euphoria was the collapse in both the ISM’s Chicago Business Barometer (which I covered here) and construction spending. While sentiment surveys are hard to judge, it wasn’t a huge intuitive leap to suggest that both data points may be related to the energy sector. While that will remain unanswered for Chicago, the construction figures are much more conclusive in that regard.
In terms of nonresidential private construction, a harder figure for capex spending and proclivity, January 2015 was only 4.1% above January 2014. That amounted, in non-adjusted terms, to a gain of just $1 billion which was the smallest advance since October 2013.
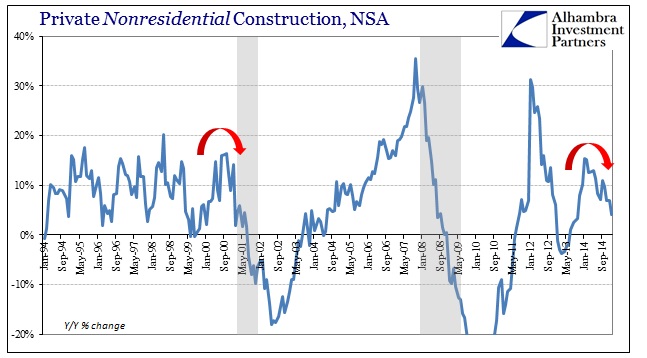
Inside that number, the “power” segment was a huge drag falling $1.1 billion itself (from $7.7 billion a year ago to only $6.6 billion January 2015). That decline has been gaining since about October when year-over-year investment in the energy/power industry started to flatline after as much as 40%+ growth earlier in 2014. Given the disparity in growth rates, and the volatile nature of the series, it could be just a temporary dip off a roaring trend. It could also be, if oil prices continue to stay below some unknown threshold, the beginning of far worse results especially if there is any “reversion to the mean” after so much artificial allocation.
But even without the drag from the energy sector, nonresidential construction wasn’t exactly robust on its own. While difficult to separate from the housing bubble and post-crisis mini-bubble, capital investment through construction is clearly on a diminished trend going back to 2012.
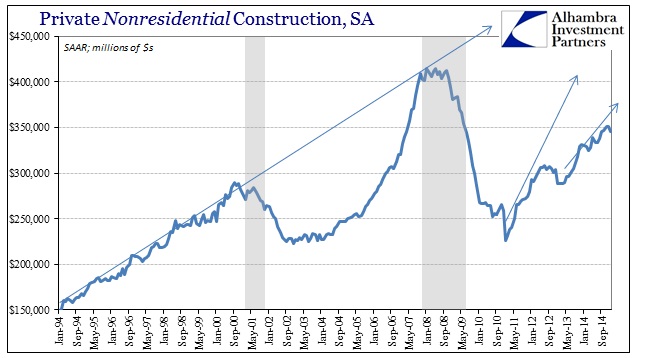
Unlike the “recovery” after the dot-com recession, capital spending here never really took off to re-establish the previous growth rate. Again, that could be the structural overhang of the bubble’s collapse, but given the data on employment and capital goods spending it fits with the idea that American businesses domestically continue to disfavor productive investment as they have since the turn of the century.
If that was the extent of the bad news in construction it would be enough to push GDP lower by itself. But residential construction has also dipped and may be in an even more concerning fashion than the still-inconclusive energy sector. Looking at residential activity here there is no doubt about the trend nor what may be pushing it.
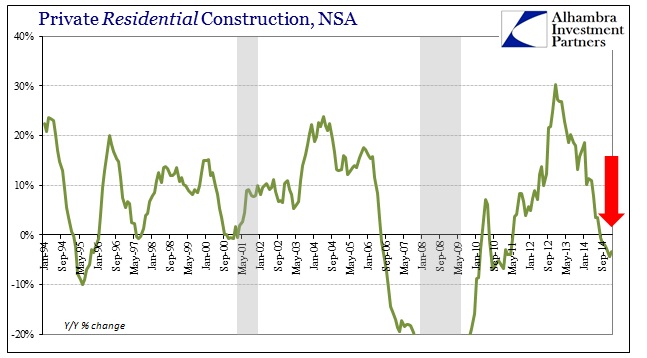
Year-over-year, residential construction has been contracting for several months which is pretty much aligned with the permit activity seen mostly in the multi-family segment. It would seem that the mini-bubble burst of 2012-13 has run its course and that the “booming” payroll expansion has had no sustainable effect on increasing demand for dwellings.
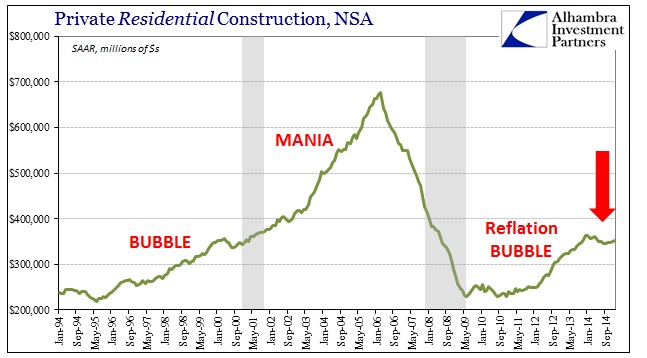
Whatever the Fed expected to get out of QE3 in terms of a direct boost to the economy has run out at a level more consistent with the late 1990’s than the intended return to 2005. That leaves the economy, GDP specifically, not only without any intended boost in overall construction (res & nonres) but actually contracting Q/Q (which is what GDP counts). Since this latest data is just for January, it will be very interesting to see if anything changes when February’s figures are released early next month. If we get the same kind of drags, or even larger, GDP will have to be recast again down to less than 1%.
Any more additional “unexpected” weakness in consumer spending, via higher savings and the same old lack of income growth, and the probability of repeating last year’s negative “anomaly” is a lot more than most people expect. It may say March on the calendar, but we are just getting to the middle of the quarter in terms of data and it is already beyond dreary.
Stay In Touch