
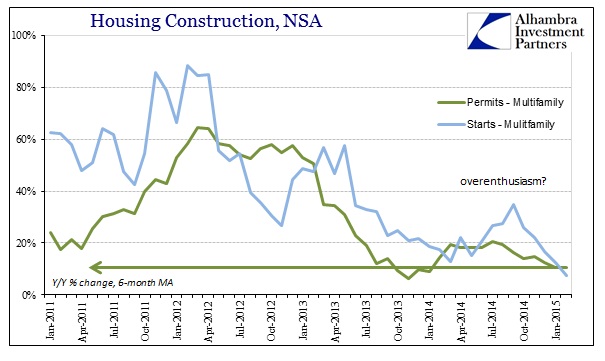
As expected from home construction figures for February the level of starts has once again reverted toward permits. For some reason, especially in apartment construction, new starts of multi-family dwellings far outpaced permit levels in the “rebound” into the middle of 2014. There is no clear explanation for the divergence, especially since permit levels show quite a bit of caution and even pessimism for new apartments. Whatever the case, growth in starts has been significantly decelerating since September.
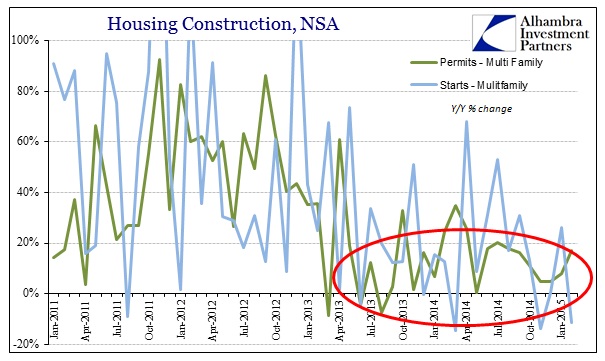
The possibility of a weather impact, especially as snow and cold would actually have an effect on whether construction could “start”, is ruled out by the fact that, again, the sinking enthusiasm for new construction predates winter. Further, despite the serious revisions last month that changed the trajectory in late 2013 and early 2014, permit activity is once more waning.
Overall, the housing market seems to have entered a curious and unique stasis. There is little additional growth or acceleration, but not much as far as deceleration either. Instead, at best, home construction seems to be stuck in a data rut.
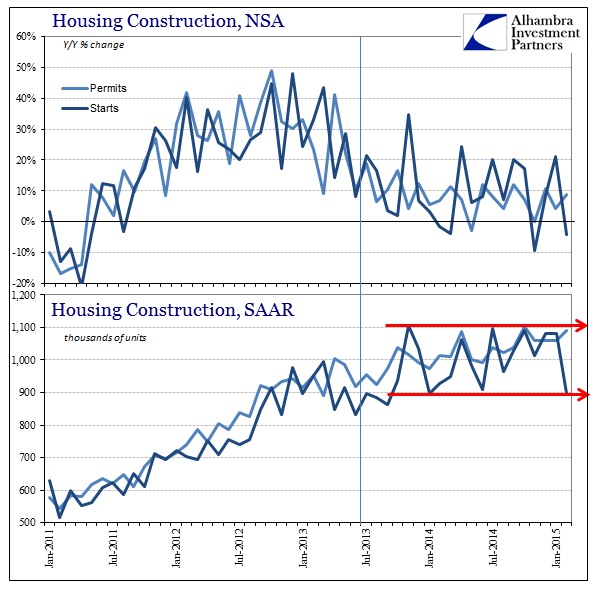
I seriously doubt that is the actuality of construction right now, instead as likely to be statistical modeling and volatility as anything else. As with most economic accounts, it is far more likely to see rising and falling than a straight-ish line, especially one stretching now for twenty months. From what we see above, apparently the violent and devastating MBS selloff in the middle of 2013, one that reduced mortgage availability by two-thirds at the worst point, simply slowed the mini-bubble to equilibrium?
Anything is possible under these conditions, though I think it far more likely that the trajectory of the housing market follows more closely the resale series from the NAR – the mini-bubble through the middle of 2013; a sharp slowdown into early 2014; an echo rebound through the middle of 2014; and finally renewed weakness. The resemblance of those inflections is somewhat apparent in this construction data, if only the general benchmark is still rising here ever so slightly.
In any case, even the data that is presented does not align with a strengthening economy let alone one that may be “booming.” The waning fervor over building yet more surplus apartments is the key indication, as a true pickup in economic function would very much lead to an increase in household demand for shelter – the kids would finally be moving out of the basement. Instead, from even the data presented here, it would seem as though construction anticipated just such a trend several years back but then found out it was never to come; the legacy of QE misallocation?
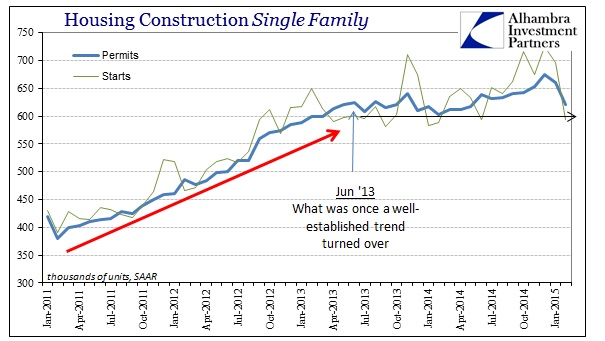
The bigger, historical picture probably describes this best. Given population increases, a low growth rate in construction is actually deficient in terms of the long-term trend. If the economy and housing markets were healing in anything like a more “normal” process growth rates would not just be far greater, but sustainably so. Even in single family homes, the pace of construction remains at a level far depressed in comparison to the historical range.
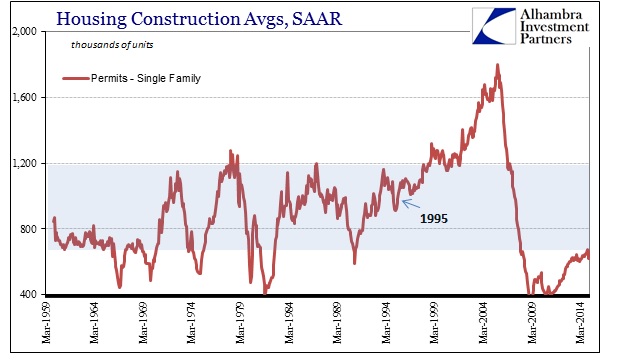
So in that respect the growth rates are deceiving, as it took what looked like a mini-bubble just to get back to a range which used to be more consistent with just plain recessions. As I said above, this current straight-line advance doesn’t appear anywhere else except the early 1960’s when the population was about half of what we see now. Maybe that is a “new normal” of misallocation, but even if that is our current reality it would simply mean that housing is not going to be a significant economic factor for a long, long time. Since housing demand is one of the primary expressions of economic “booms”, especially artificial, it doesn’t say much for the current climate of “demand.”
Stay In Touch