At first glance, yesterday’s release of new home sales estimates defied any sense of sense. As such, it seemed better to simply let it alone until revisions attempt to address the extreme outlier results for February. However, after further review, there may be another factor to consider as to whether there is anything worthwhile rather than being wholly inappropriate.
At issue is the lack of weather and thus the departure from all the other accounts of the real estate market. If weather and snow have been keeping people from home shopping then it stands to reason there would be a depression in the sales of new homes. This would be particularly true where the weather has been harshest, even perhaps beyond last winter’s apparent economic decay.
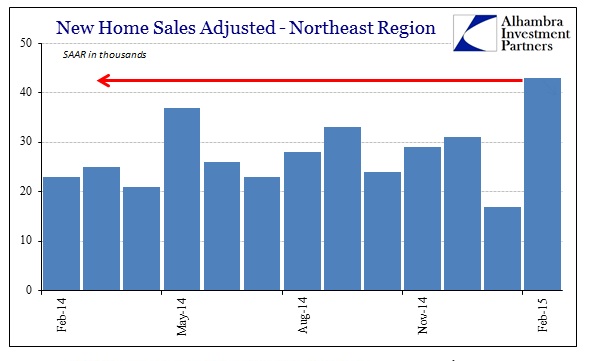
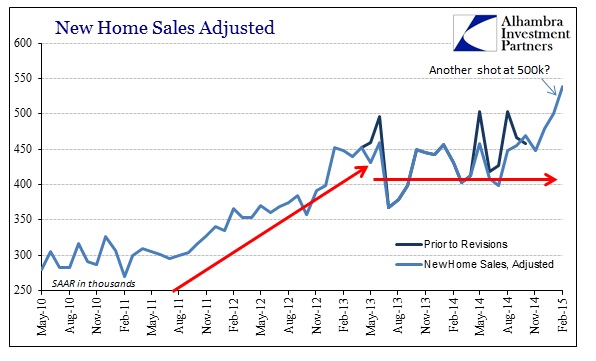
But rather than conform to that idea, new home sales especially in a Northeast region beset by unbelievably cold and snowy conditions surged beyond any notion of anything. The Census Bureau is estimating that there were more new homes sold, at a seasonally-adjusted annual rate, in February than at any point in years, snow or sunshine (I should point out that it is not my contention about weather depressiveness only that convention has latched onto winter as plausible for economic disappointment).
There were also some gains in the South, but declines in the Midwest and West. The net result was a February figure that seems simply outrageous.
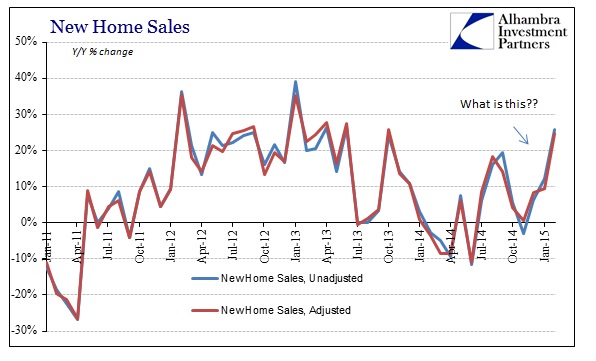
Last February wasn’t exactly a bountiful month, so there are base effects to consider even though they “should” have been wiped out by the weather in common. This data series more than most is especially volatile and difficult to judge particularly on a one- or two-month basis, so it is unsurprising to see that the range of “accepted” statistical estimation is unusually wide given these huge calculated numbers.
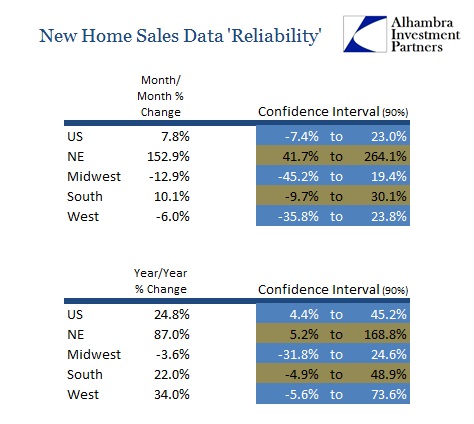
Where the emphasized estimated monthly change in the Northeast was an astounding 152.9%, that isn’t quite what the Census Bureau’s figures mean. Using their provided 90% confidence interval, what these numbers say is that the Census Bureau expects given the exact same conditions without any uncounted or reintroduced biases that in 90 times out of 100 they will get an estimated answer between +41.7% and +264.1%. The published monthly change is where they estimate these “simulations” to cluster, thereby, stochastically, arriving at what they think is the “likeliest” estimate in a very wide but ultimately useless range.
For the Midwest, then, the Census Bureau estimates that 90 out of 100 rerun surveys would show an answer between -45.2% and +19.4%; meaning that it is likely to be somewhere between very, very bad and pretty darn good.
What we can surmise is that the Census Bureau’s survey produced surprisingly strong results completely out of line with prior history and factors to the point that it looks increasingly biased in and of itself; thus yielding huge confidence ranges. All of that simply means there isn’t a whole lot of validity in these figures as separate monthly numbers. And that is why I originally thought to simply skip the month entirely until further data can confirm that the housing market just kicked back into bubble territory or it was just another statistical discrepancy in a recent string of them.
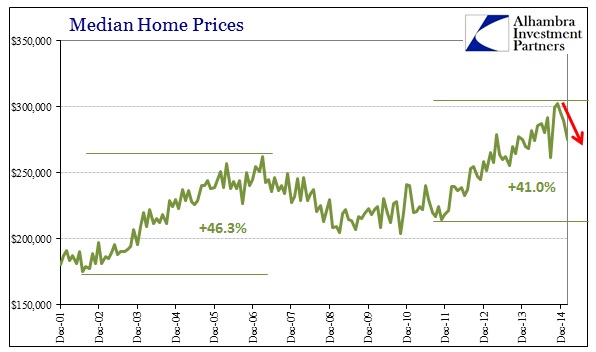
That being said, it was the further decline in estimated prices that brought out a suggestion of possible usefulness. Prices are just as wild here as the number of monthly estimated sales. But in the past six or seven months, there have been a rash of declines, even separating out September/October’s big move (down then up). In the past three months, which is more likely to be a realistic determination, the estimated median sales price has fallen by 2.4%, 2.1% and 4.8%, in order. That has brought the median down from $302,700 in November to just $275,500 as of February.
There is normal seasonal declines expected in the median price, but by way of comparison the price change from November 2013 to February 2014 was from $277,100 only to $268,400. The year before, the median price actually increased significantly, from $245,500 in November 2012 to $265,100 by February 2013. In other words, the price decline (if real and not statistical phantom) is quite large and far out of recent historical experience.
That may offer at least a consistent explanation for the rise in new home sales over the winter (again, if it is real) that actually matches other housing indications (such as resales) going the other way. If the real estate market is softening, which construction figures suggest, then perhaps builders have absorbed economic expectations (real, not the imagined FOMC version) to the point they have had to mark down significantly new homes to sell them as fast as possible. That point may be reinforced by what is taking place with the “dollar” which serves as notice of financial “tightening” across many financial sectors – including, potentially, home builder leverage built into new property development.
In other words, again given the assumptions, tighter financial conditions and the related faltering economic picture may have led builders to slash prices on their products in order to get out before rollover financing becomes disastrous and they are left with margin calls on those loans and no realistic ability to move inventory. It would be a last ditch effort to salvage what they can before conditions become too unfavorable.
Honestly, I doubt even that is the case, but it is in my estimation far more plausible than that which sees new home sales moving all their own into a new and third bubble phase. It is at least worth considering given the poor, poor state of the data at hand.

Stay In Touch