
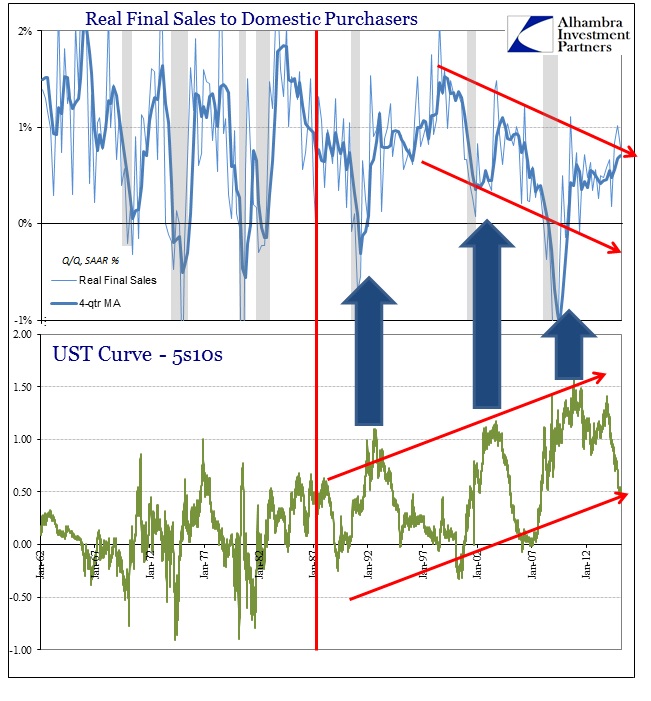
The emphasis of QE in terms of “portfolio effects” and interest rate “stimulus” is to visit upon the entire curve what monetary policy has done in the past in only the shorter maturities. So the evolution of monetarism under activism and interest rate targeting is to bring the entire curve down whereas before it was content to intrude only in the front. You can actually see that evolution as it takes place in economic chronology, including the effect on the yield curve.
Not only do nominal interest rates fall over time, that starts in the front end where monetary policy is (was) mostly conducted before infecting the entire edifice. The major implication of that is as the yield curve moves to the policy tune the real economy “suddenly” stops being oriented toward growth.
In the two recessions shown above, this transformation is easily apparent as the curve dramatically steepens shortly thereafter. That is not the expression of actual economic sentiment, however, as only the front end moves while the outer maturities remain eerily constant and stable (until QE2). So the shape of the yield curve is being driven by monetary expansion.
Except that when thinking about lower interest rates as a matter of policy, convention still falls upon the Federal Reserve doing something to make that happen. In fact, up until QE, monetary policy did nothing except proclaim a target – the banking system created the actual effect. That may seem like a distinction without a difference but it is vital to understanding how and why the economy stopped taking on more serious growth.
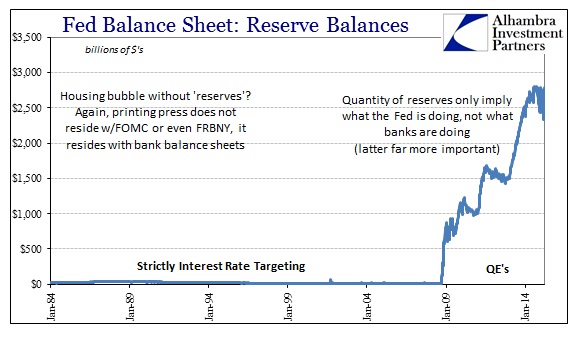
The role of bank reserves, the Fed’s so-called printing press, is nothing but an illusion actually carried out by the real printing press under the wholesale model – bank balance sheets. If the Fed then undertakes “stimulative” interest rate policy by reducing the target for the federal funds rate, the Open Market Desk (pre-QE) makes only imperceptibly minor changes to maintain the effective federal funds rate at its target (with operations centered around “maintenance periods” not actual realtime). The banking system takes care of the actual liquidity theoretically through expansion or contraction.
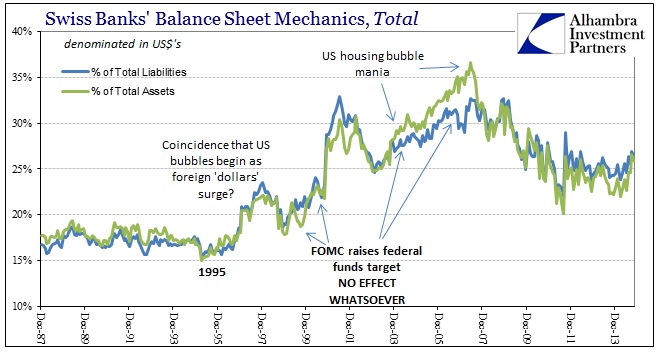
But that doesn’t actually happen either, or at least it didn’t especially after 1995. During the few periods where the FOMC raised its federal funds target, notably 2004-06, there was no actual contraction in banking activity whatsoever. All that changed was the “market” cost of funds that was set by decidedly non-market considerations. Instead, bank balance sheets reacted to these circumstances far differently than expected by theory. That means the “cost” of funds starting at the federal funds rate has nothing to do with economic considerations of profit and loss, so that the entire slew of financial activities must be adjusted accordingly (which is why insurance companies like AIG suddenly became interested in securities lending while investment banks like Lehman Brothers derived more and more profit from what used to be strictly dealer activities turned speculation as “prop trading”; there is a reason that it is exceedingly difficult for regulations to define what might count as “hedging”).
Banks were already altering behavior in the 1990’s because interest rate targeting offered no real constraint in liquidity whatsoever. So the yield curve, like the track of bank “reserves” shown above, became rather detached from economic considerations and reflections and became more so only a statement and signal about monetary policy intentions. In what really mattered, global balance sheet expansion in “dollars”, the artificiality of the curve only altered the exact expression (for example, in the 2004 era global “dollar” participants reacted to the squeeze on spreads by taking on more risk not less, the exact opposite “portfolio effect” that monetary theory expects; monetarists anticipate a “portfolio effect” when interest rates are low but that episode along with the current existence demonstrates rather conclusively that orthodox theory is not just wrong but totally backwards).
The only real constraint on “dollar” debasement was actual economic condition, as the recession in 2001 and then starting in 2007 were the only true alterations to funding trajectories.
That simply means Greenspan’s “conundrum” about long-term rates was mostly a reflection of how little control the Federal Reserve actually held; and thus why the Great Recession was such a negative and asymmetric downside. Intending to create a methodology of financial control, the activist central bank was activist really in the respect that it removed all limitations on the “dollar” while, as I noted yesterday, using the federal funds rate to suggest mostly to the public about its reach. Instead, it was only a one-way mechanism where credit and funding markets “reacted” not to the Fed’s attempt at slowing or constraint but in signaling how fast to go about it all. As long as that created GDP everything was viewed fine and acceptable.
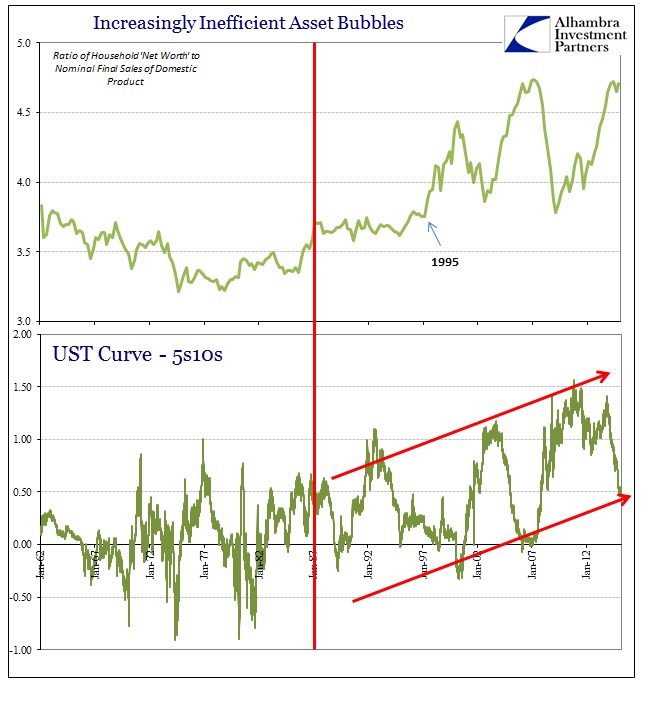
With the overall yield curve only telling economic agents about what the Fed was trying to accomplish, there was a major problem in resource allocation through the acceptable price of “risk.” It is absolutely clear that US corporations, in particular, took that view of the yield curve not as a matter to engage in productive risk but instead financial risk. The artificially steep curve was the parallel transition from monetarism to bubble, as it acted pro-cyclical in tandem with what the banks were doing without any constraints of their own. In short, financialism dominated more and more, with the yield curve showing only that factor (and thus creating massive confusion for Greenspan and Bernanke by 2005).
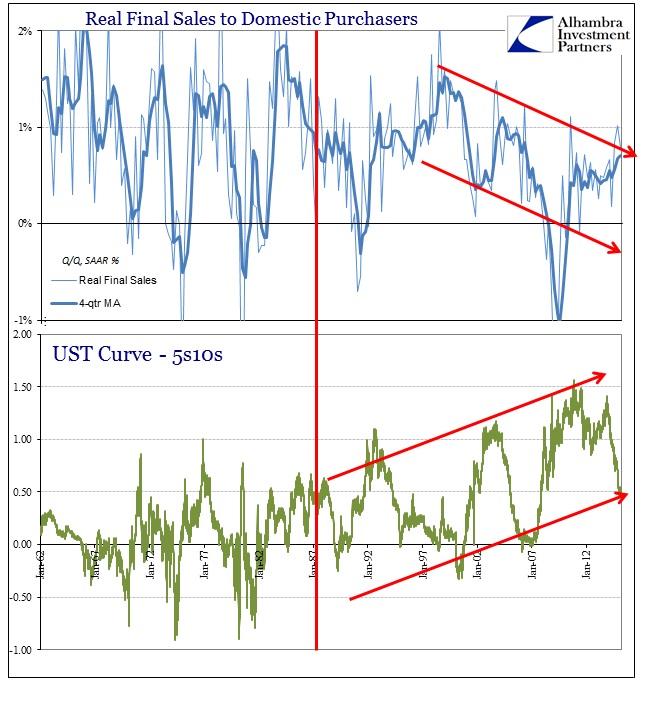
The chart above shows this relationship well, though orthodox economists will undoubtedly assert backward causation – that the weakening economy was itself cause for greater monetary intrusion through the steeper yield curve rather than financialism through bubbles scalping too much of the real economy. That is the theoretical basis for “secular stagnation” after all, as monetary policy by “virtue” of its mathematical equalities can “never” be so inefficacious (monetary neutrality and rational expectations). So they will blame the economy and call the coincidence of asset bubbles exactly that (or “necessary” as described by some including Krugman).
But if the yield curve (shape) itself has become only a function of monetary policy intentions, that cannot be anything but a corruption upon honest trade. After all, there is an obvious asymmetry to the entire endeavor from its inception sometime in the latter 1980’s (likely by 1987 and Greenspan’s first authoritative actions for sure). In other words, with each successive “cycle” nominal rates get lower and lower while the yield curve gets steeper and steeper, all of which suggests an actual market resistance to the repeated attempts. So policy has to take bigger and bigger steps to “force” the market to dance to the intended “stimulative” tune – the very reason the federal funds target was brought all the way to 1% after the dot-com recession and “jobless recovery” and then the zero lower bound was finally breached by QE after the Great Recession and its asymmetric “jobless recovery.” Market behavior suggests, strongly, repeatedly crashing to return toward balance and discipline while the Fed cannot allow market behavior to occur.
That violates any actual idea of monetary neutrality regardless of forced equalities through general equilibrium theory. It is clear by the yield curve’s perpetual behavior in this regard that monetarism is not compatible with markets but rather a distinct and decisive corruption upon them. That bubbles result is only an expression of just how far policymakers “have” to go to achieve their desired results – in the form of cosmetic changes to a yield curve, depending then upon economic and financial agents to carry out the effects.
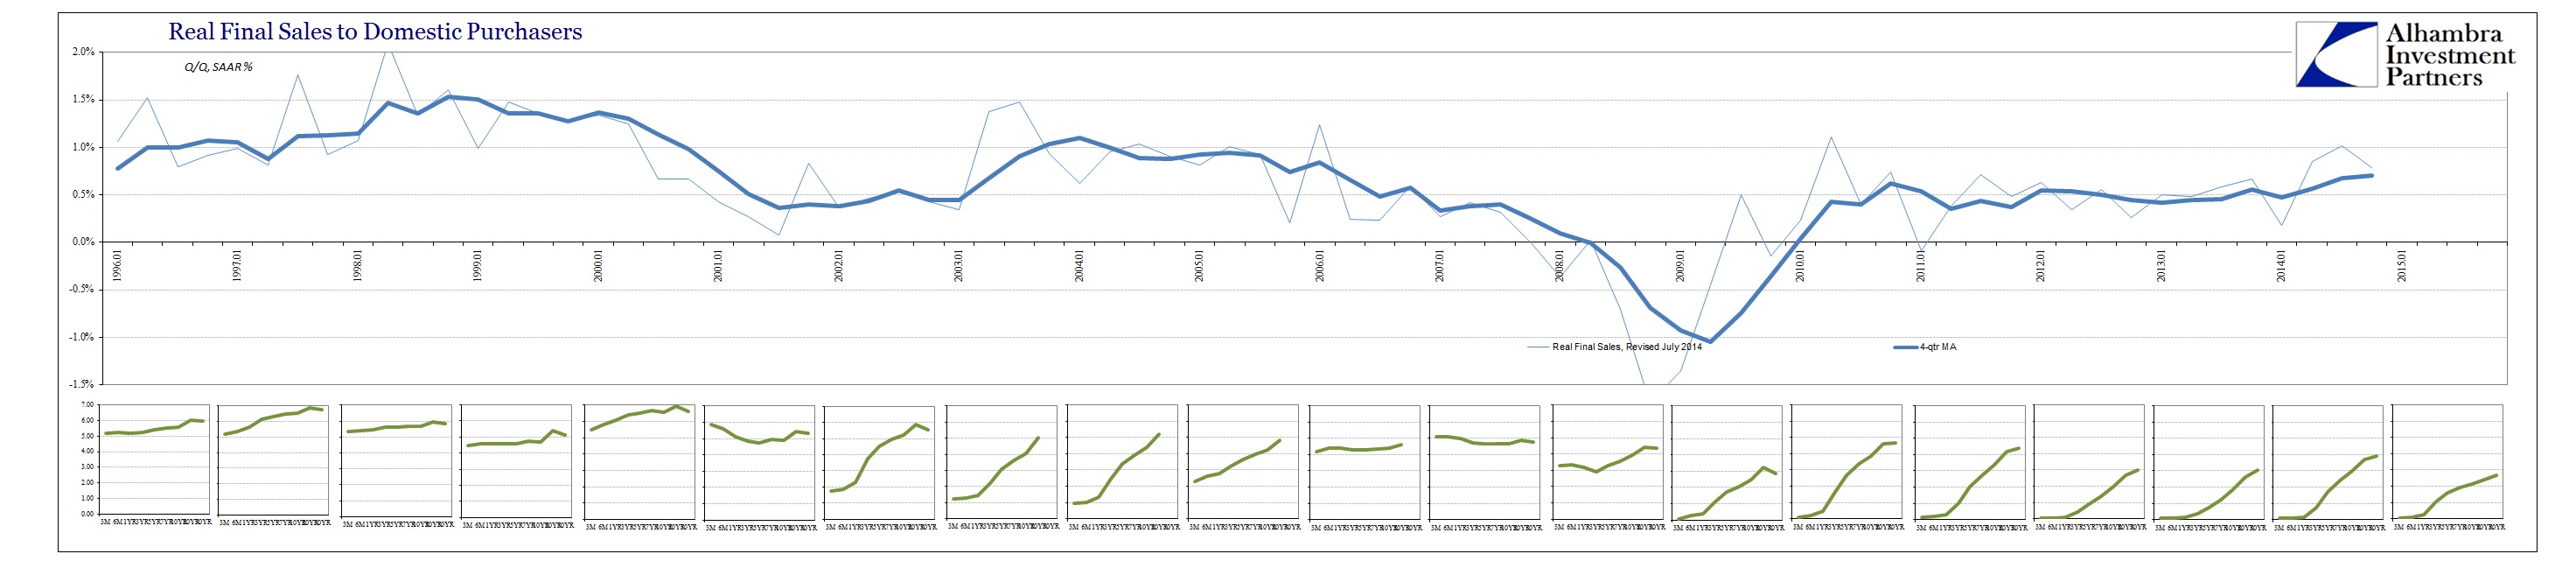
The fact that the heaviest changes in the yield curve’s artificial steepening occur in the immediate aftermath of recessions strengthens this view. If markets acted as according to rational expectations theory, then they would at that point be expected massive growth to result in each recovery. Instead, recoveries themselves have gotten more and more listless and thus not reflective of what the surface of the yield curve is supposedly expecting. The net result is increasing inefficiency in terms of transmitting growing and massive financial imbalances toward GDP or some real economic function.
What gets established is therefore a relationship between slowing growth and greater monetary intrusiveness. The entire affair upends normal function, as the steeper the yield curve attains the slower the economy grows. That is not the true time value of risk, but a full and destructive corruption of the financial bedrock. The steep yield curve is supposed to signal growing confidence in economic sustainability and depth, but instead has been obliterated to only demonstrate the corruptive lengths that monetary policy has attained. That includes, of course, the “effects” of QE as the latest and heaviest venality.
In this all-encompassing respect, what the yield curve behavior suggests is not just casual correlation in terms of time periods between bubbles and monetarism’s heavy hand, but rather full-blown proportionality. Economists refuse to look at it as anything but “secular stagnation”; the actual function of finance shows conclusively that it, like these command theories, is backwards.
Stay In Touch