
In the age of ZIRP it can be difficult to gain perspective especially about interest rate movements. Trying to analyze the ups and downs including any relevance or importance is clouded by the lack of historical clarity on that account. We really have no idea about the true significance of scales at and near the zero lower bound because this is the first time we have ever been forced to visit it. The closest comparisons are to 2010 and 2011, but even then there are the matters of “dollar” swaps and a few more QE’s to contend with as potential systemic alterations that may have altered the baseline.
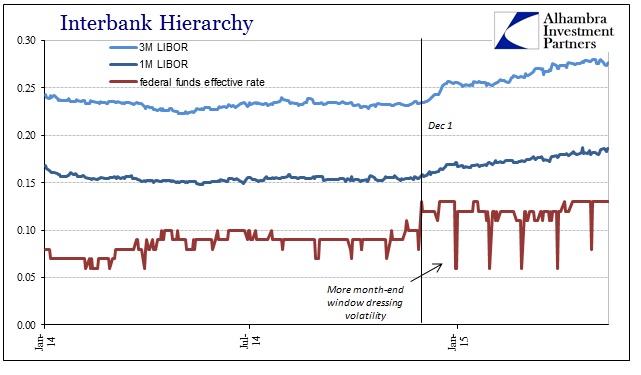
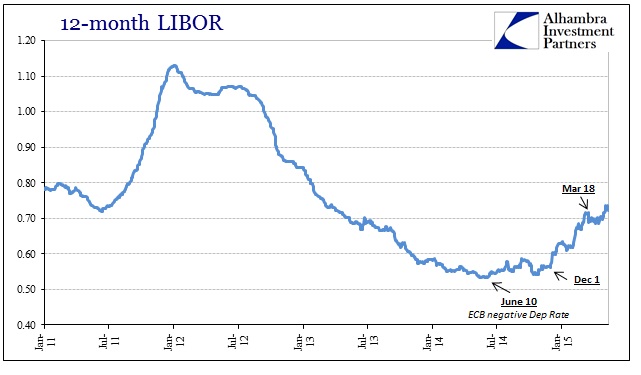
At issue right now is the persistent rise in LIBOR, especially at the 12-month maturity. While the 3-month gets most attention, it, along with the 1-month rate, are far more intricately tied to monetary policy targets and intentions. That is why even the small increases in 3-month and 1-month LIBOR stand out so much even though the absolute change amounts to only a few basis points. At first thought, it seems like that might be related to the FOMC’s possible intentions, but these changes rather align more closely to global “dollar” events (especially December 1) and shifts than anything about what the FOMC might or might not do.
By way of comparison, 3-month LIBOR rose 14 bps on August 9, 2007, alone, signaling for the first time that the eurodollar system as a whole was becoming unworkable globally. But that was where 3-month LIBOR started at 5.38%, not 22 bps. In percentage terms, the recent increase is obviously greater, but that itself does not imply or convey significance; at least not on its own.
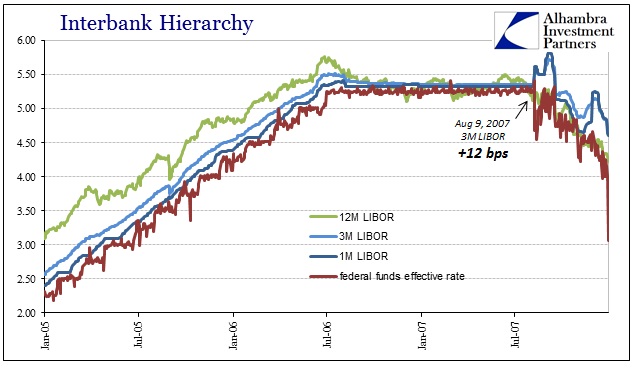
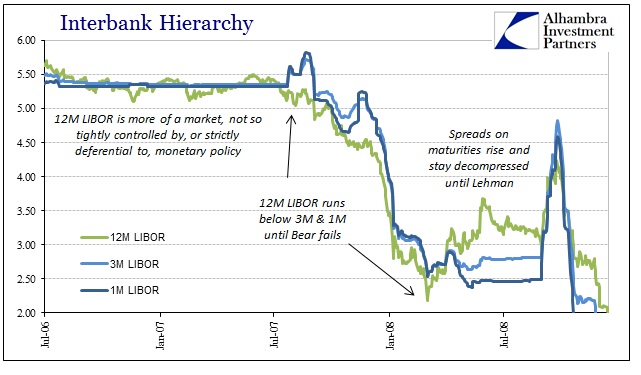
While 3-month LIBOR was ripped away from its very stable place alongside federal funds, 12-month LIBOR actually trended lower, creating a negative calendar spread that lasted all the way until just after Bear Stearns failed. The twelve-month maturity is, by comparison to the shorter end, much more of a robust market. The further away from monetary policy, once limited to O/N, the more actual information, potentially, conveyed via the actual interest rate. In terms of the months immediately after August 2007, what the negative calendar spread to the 3-month conveyed was expectations for both a short duration to the crisis and a robust monetary policy response in the form of interest rate cuts.
After Bear Stearns, however, 12-month LIBOR shot right upward indicating during especially the summer of 2008 (when the Fed had convinced itself the worst was over) that the crisis was not only enduring, it was getting worse and would last longer. The market’s initial faith in Fed policy had proven unfounded, and it was suggesting to anyone paying attention that matters were far more dire than they were taken.
In other words, there is potentially some significance in the changes in 12-month LIBOR even now in relation to what is left of interbank hierarchy. And that means, more recently, that the suspicious rise in 12-month LIBOR may be suspiciously meaningful as an indication of “tightening” and general illiquidity of eurodollars more broadly. That is especially important given that the eurodollar market is all that remains of significant liquidity capacity in the post-QE world.
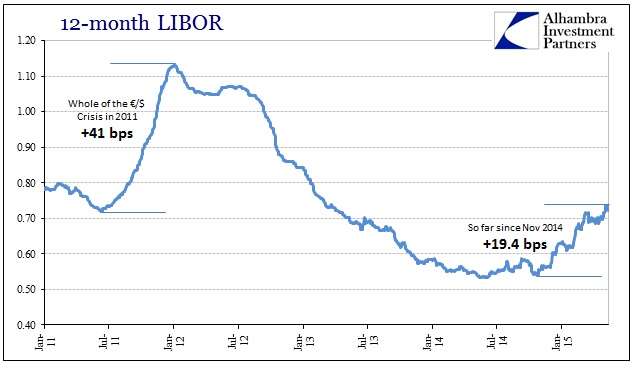
Going back to the end of November, 12-month LIBOR has risen around 19 bps, with a very definite surge starting, in tandem with the rest, at December 1.
Again, that does not sound like a whole lot on its own, but in the very deep (and recognized) liquidity crisis in 2011 12-month LIBOR gained a total of 41 bps start to finish. That, I believe, offers some good perspective as to why the ruble crashed, the Swiss ended their peg and generally decrepit liquidity has prevailed throughout. It does not, of course, suggest the cause of all that but merely the scale which fits neatly with other forms of observations on the subject.
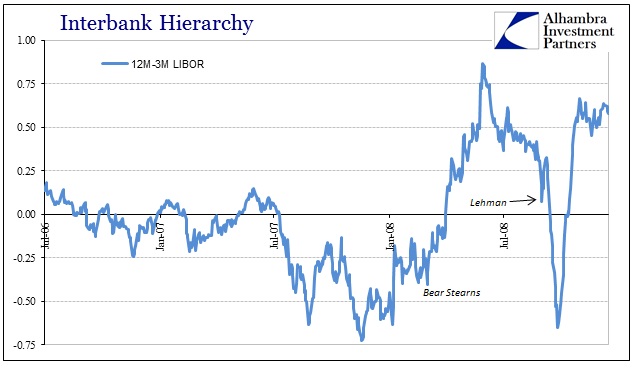
In terms of the actual maturity spread, 12-month to 3-month, the current decompression is perhaps even more significant.
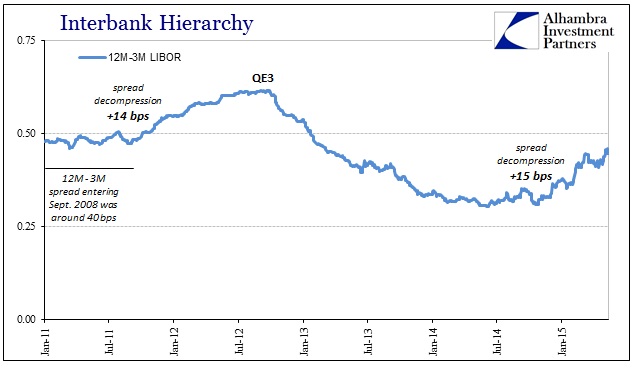
As a reminder, in the charts above, the 12-month to 3-month LIBOR spread was usually less than 15 bps prior to August 2007, meaning irregularity has persisted and prevailed throughout despite whatever the Fed and other central banks have done these past almost eight years. I am not in any way suggesting that liquidity conditions now are as bad as 2008, but that the fact that there are so many similarities here (and to 2011) begins to explain this:
The importance of liquidity is not necessarily straight-forward, particularly under current circumstances. Liquidity alone does not directly affect asset prices, or even securities and lending, but it certainly plays a role as one of the primary factors. Low liquidity does not suggest a market (or markets) crash, but rather if or when perceptions change and bubbly buying suddenly turns to selling there will not be much cushion or capacity to absorb it.
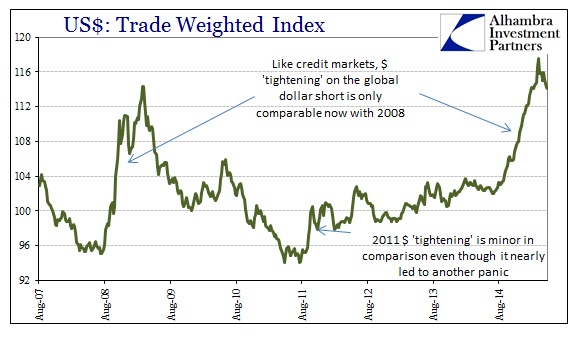
There have already been numerous financial problems globally so far under “dollar” tightening but no real, sustained selling pressures. If there are differences between now and those prior two “larger” episodes, it was that alone – namely that financial firms were much quicker to sell assets of all types to maintain liability structures. Now, that has largely dissipated but continued systemic problems on the liability side have failed to match rising asset structures. You can make the case that QE and the like were successful in taking the selling edge off, but then they did nothing about preparing fro when the buying frenzy might suddenly stop (and a great deal of harm to the system that was supposed to be in place to maintain order when that day came). These are different means of expressing what amounts to the same problem: grand financial imbalance.
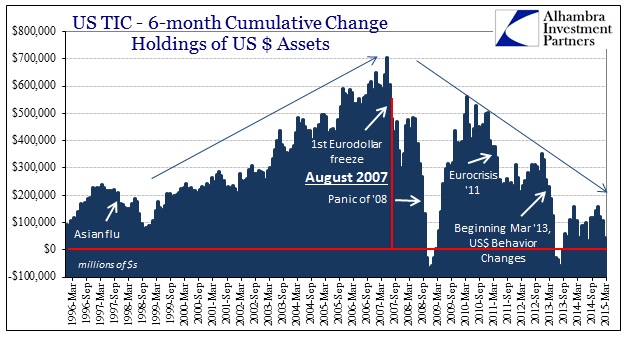
As a visual expression, we can see this take shape as the overall eurodollar standard retreats, especially starting in the middle of 2013. The world has a “dollar” problem, still, and it is more than festering. Asset prices and asset levels seemed to have normalized as intended, but the superstructure, globally, supporting it is as unsound (maybe worse) as it was in those more open events.
In other words, the exits in 2008 and 2011 were narrowing at the same time everyone, and I mean everyone, was trying to access them. Now, the exits are being restricted with only a trickle (depending on your global perspective) heading toward them. That is the asymmetry we see in the “dollar” and with so many other irregularities.
The FOMC continues to pretend that everything is fine and that the way is clear, financially, for them to “exit” ZIRP. They made the same mistake in 2008, misreading liquidity indications in much the same fashion. The change in 12-month LIBOR is, in my opinion, significant on its own but especially on the basis of historical comparison and the fact that its movements relate directly to non-policy events. If the herd does turn at some point, they are going to find the exits extremely narrow and small, getting narrower and smaller by the week.
Stay In Touch