
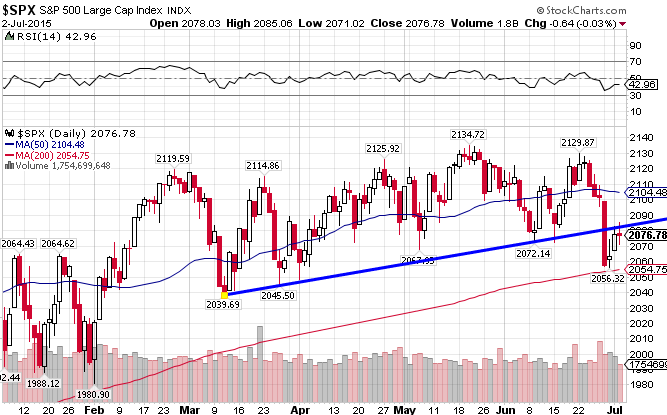
The S&P 500 Index ((IVV)) zig-zagged with no certain direction for the first part of the year, gaining just under 2% during this somewhat volatile period. The index sits right below support at the 50-day moving average and is certain to retest the 200-day MA now that the Greeks voted against more austerity measures. We might finally be in the midst of the long-talked about correction.
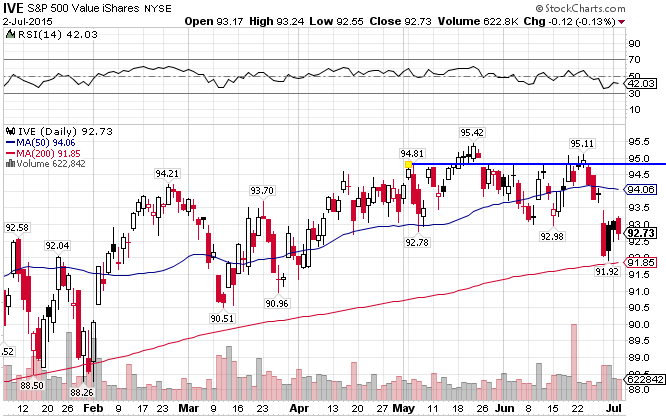
The S&P 500 Value Index ((IVE)), which consists primarily of US large-cap value stocks in the financial services, industrial, and consumer cyclical industries, tend to have lower price to earnings ratios and higher dividend yields than the market as a whole. The value index has been out of form this year, having underperformed vs the S&P 500. The index is flat for the year.
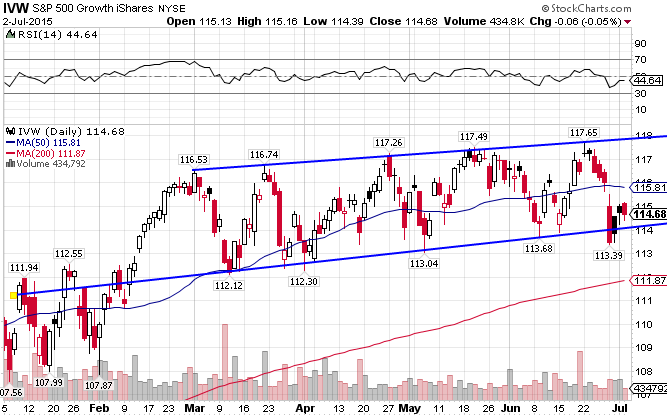
The S&P 500 Growth Index ((IVW)), which consists primarily of US large-cap growth stocks in the tech, healthcare, and energy industries, tend to have higher earnings growth rates, higher earnings multiples, and little or no dividend yields. Growth stocks have been the better bet so far in 2015, as the index is ahead of pace set by the S&P 500, returning 3.47% YTD.
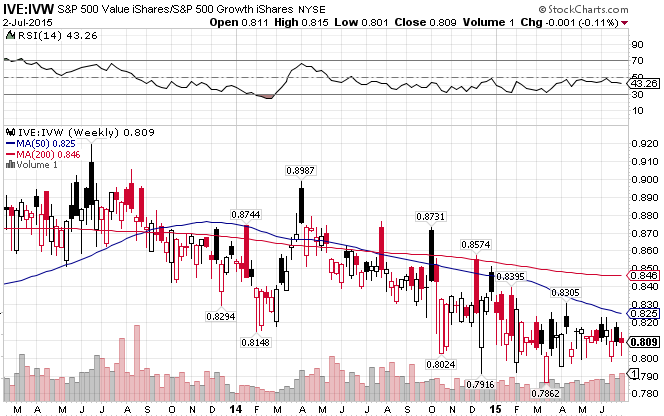
A short-term trend of growth stocks solidly outperforming value stocks has emerged. Over the longer term, you can see the shift from value stocks to growth stocks occurring in mid-2013.
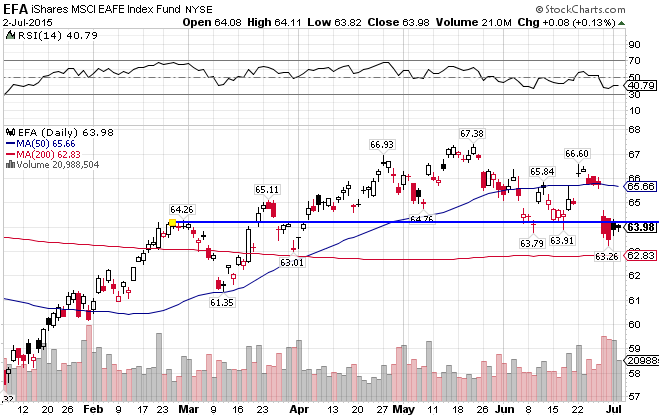
While the MSCI EAFE Index ((EFA)), a global developed market index that encompasses Europe, Australasia, and the Far East, had significantly underperformed versus the S&P 500 in 2014, that has not been the case this year. The EAFE Index is outperforming the US markets by a wide margin so far this year, gaining 6.94%, but like the US markets, it now finds itself below the 50-day MA and temporarily breaking its short-term uptrend line. With the uncertainty involved with Grexit, look for the spread to shrink.
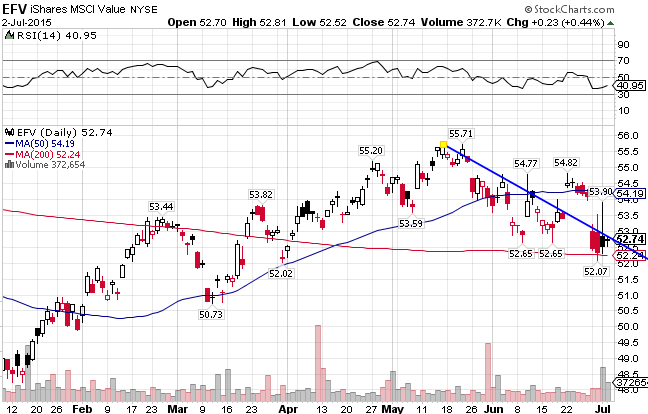
The MSCI EAFE Value Index ((EFV)) consists primarily of low P/E international large-cap value stocks in the financials, energy, and communications industries. Like the US markets, international value stocks are also underperforming growth stocks of late, returning 5.61% YTD. The chart also looks a bit more negative than its growth counterpart, as the index is deeper into its downdraft (closer to the 200-day MA) when compared with the growth index.
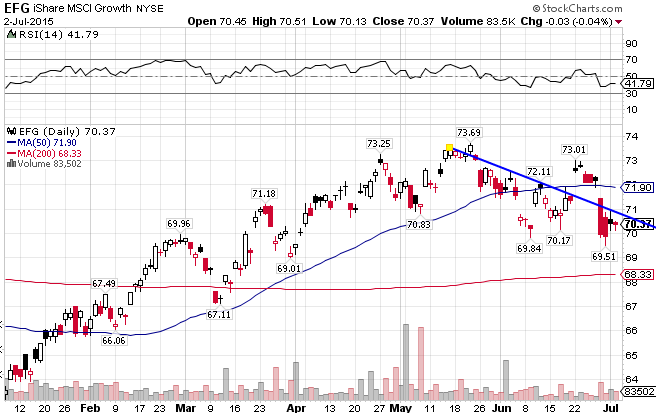
The MSCI EAFE Growth Index ((EFG)), which consists primarily of high-growth international large-cap growth stocks in the industrial, healthcare, and consumer cyclical industries, has outperformed compared to the value index. The index is up 8.28% YTD.
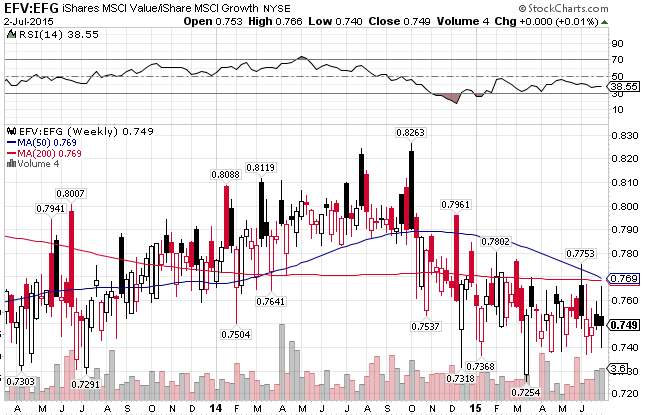
Over the long term, a shift from value stocks to growth occurred in late 2014.
Stay In Touch