
Economic reports scorecard 7/20/15 – 7/31/15
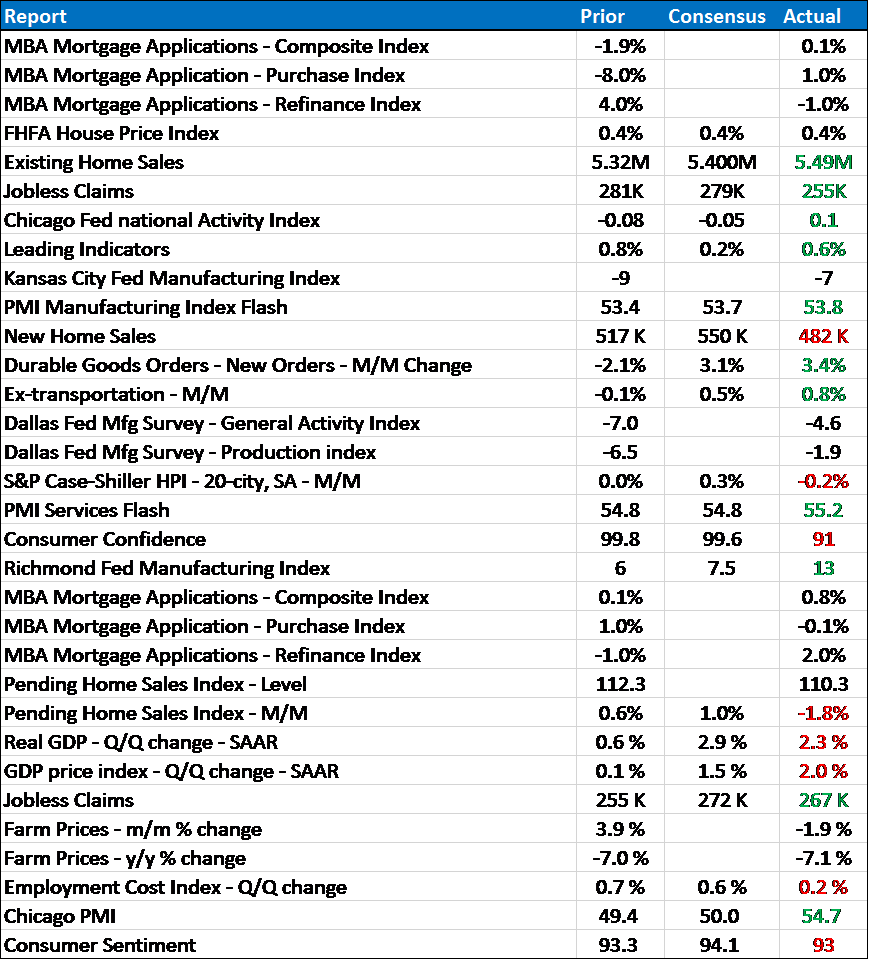
The economic data releases since my last update were a bit better than expected but as the GDP report showed, the US economy continues to plod along at a disappointing pace. In fact, the GDP report was, in my opinion, not as good as the headline with investment a particularly disappointing aspect. I would also be skeptical of the trade figures used in the report which showed both imports and exports rising smartly. That just doesn’t jibe with what we’ve seen in the separate trade reports or pass the common sense test given what is going on in the global economy at present. The personal consumption portion of the report also raises an eyebrow at a +2.9% given the recent retail sales reports but I guess we have to, for now, take the report at face value. The large annual revisions included in the report are evidence that all these initial estimates should be taken with a boulder of salt in any case.
The investment figures are important because it is investment that leads the economy into and out of recession. In last quarter – again, assuming the figures are accurate – Gross private domestic investment was up a puny 0.3% and only that amount because of a surge in residential investment and intellectual property investment (which appears to be rapidly becoming the government’s go to fudge factor by the way). The details showed a drop of 1.6% in non-residential structures and -4.1% in equipment. Inventory was a non-factor, subtracting just 0.08% from GDP, another detail that is bound to be revised by the way. Of course, a lot of the drop in investment is related to the ongoing struggles of the shale industry but given how weak investment has been in other industries since 2009, the drop there is having an outsized impact on the economy as a whole. As I’ve said many times, I have no idea if the drop in shale investment will be sufficient to put the economy into recession but the evidence so far isn’t particularly encouraging.
From the reported data of the last two weeks, about the most that can be said is that the economy is inching forward. Housing was the best part of “investment” in the GDP report but the more recent information is mixed at best. Existing home sales – which have little impact on the economy and GDP – were better than expected but both new home sales and pending sales were disappointing. The manufacturing data improved marginally but still the sector remains the weakest part of the economy. The durable goods data was okay on the surface but the details were less encouraging. There is still no inflation pressure to speak of and the ECI report Friday should quiet those who think – for some reason – the labor market is tight. Consumer sentiment is only coincident data which makes it a bit interesting that it has been waning recently. Have we already seen the best of this lousy expansion?
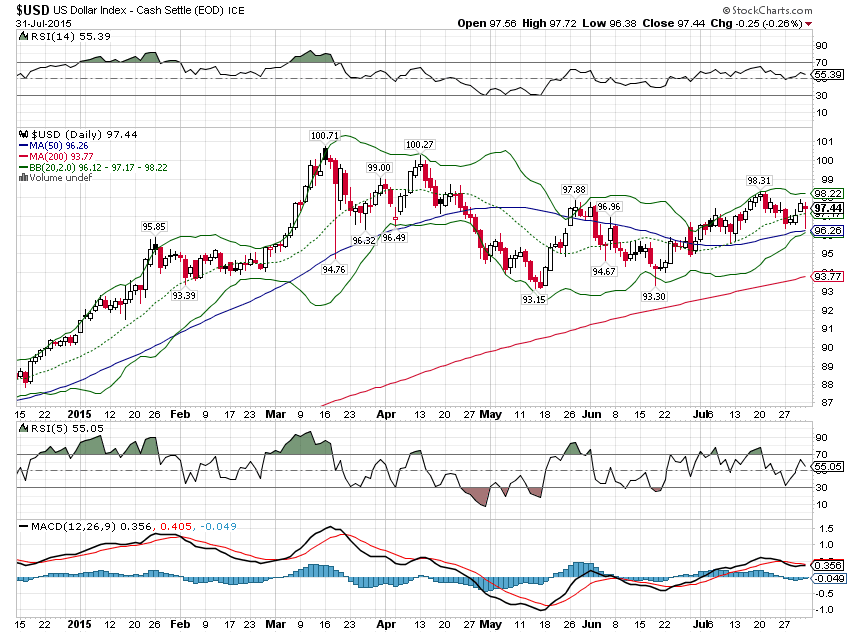
Moving on to our main economic indicators, the dollar has been, I think, surprisingly weak given all the international turmoil. With Europe still Greeced and China’s stock market falling apart, one would have expected a much stronger bid for dollars but instead it has been struggling. That is a reflection of two things – growth and inflation or interest rate expectations. Growth after a lousy first half will have a hard time reaching even the punk new normal rate of 2 to 2.5% this year. Inflation expectations, which drive interest rate expectations, have been moderating recently (although interestingly, real growth expectations as reflected by real rates have barely budged) especially after the extraordinarily weak ECI Friday.
Falling inflation expectations flattened the yield curve somewhat since my last update:
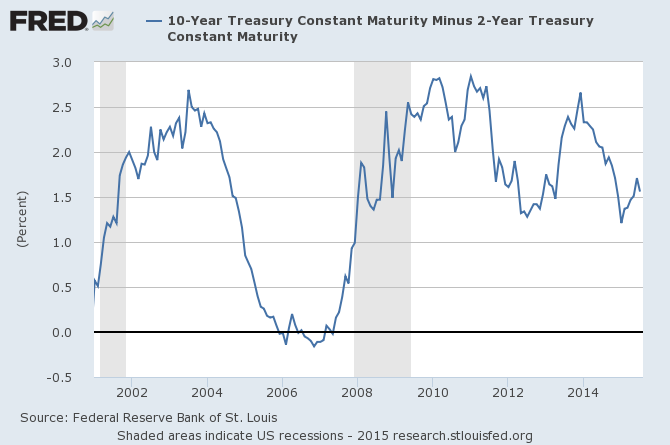
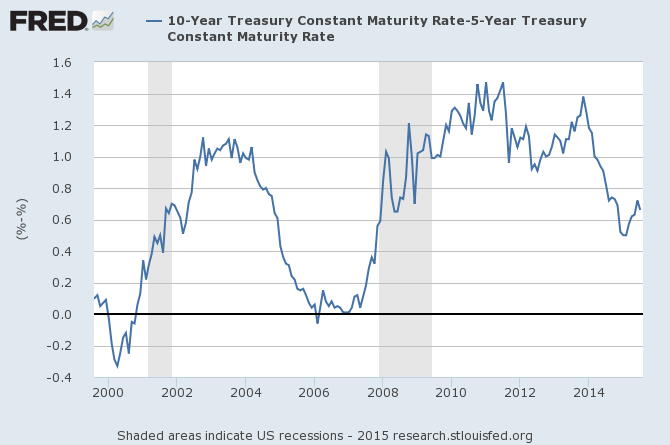
At 0.66% the 10/5 spread is still in Zone 3, indicating a low probability of recession based on historic experience.
Credit spreads are not acting well, widening considerably for the month of July. The month to month change in the HY Master II OAS is in fact sufficient to give us a stock sell signal in our asset allocation model (which I’ll update next week). Baa spreads continue to widen as well, showing that the stress is not confined to the junk sector (Baa is the lowest investment grade rating by Moody’s, equivalent to BBB from S&P).

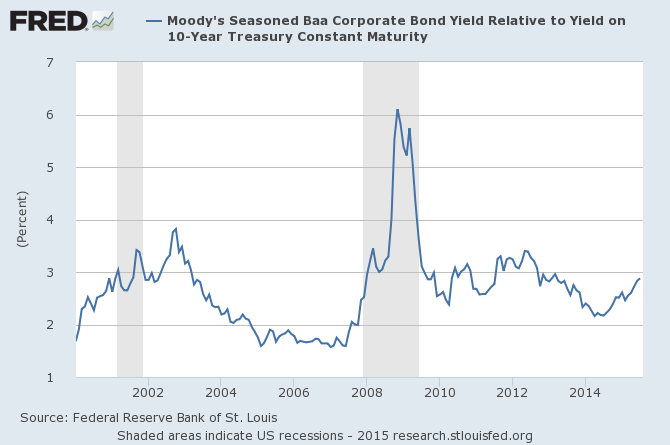
Our big picture economic indicators continue to present a mixed picture. The data is consistent with what we’ve seen over the last few years of 2% growth with the manufacturing side of the economy performing poorly and the service sector holding up so far. Housing bailed out the GDP number in the second quarter but it isn’t strong by any historical measure. Investment remains weak and the ongoing shale bust seems likely to make that worse in coming quarters. Global economies are not adding much, if anything to US growth. The yield curve is flattening again, a result of falling inflation expectations primarily. Credit spreads are the most worrying indicator by far, offering up a rare sell signal in July. Credit spreads do throw up false signals though and could easily reverse in August. One caveat though is that this isn’t a particularly good time of the year for stocks with September the worst month of the year statistically.
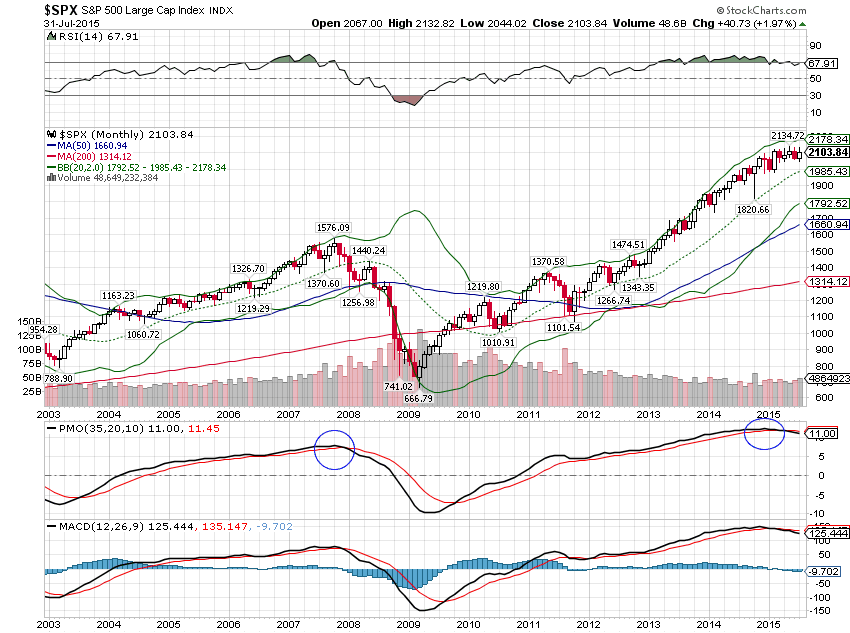
Overall, I think the most likely outcome is for continued sub-par, unsatisfying new normal, secular stagnation like growth. If credit spreads keep moving wider though, a recession scare is not out of the question. In fact, considering the technical picture right now, that would be a convenient outcome. Momentum, as I’ve noted previously, has rolled over on a long term basis, a sell signal not seen since late 2007:
I am certainly not prepared to say that a recession is imminent but a recession scare seems logical. The stock market is itself a pretty good predictor of future economic growth so the change in momentum should not be dismissed blithely. The economic indicators and the stock market both argue for caution right now. A look at recent bond returns (see the Weekly Snapshot) shows 4 of the top 6 performing bond ETFs are Treasuries, so the bond market is on board as well.
Stay In Touch