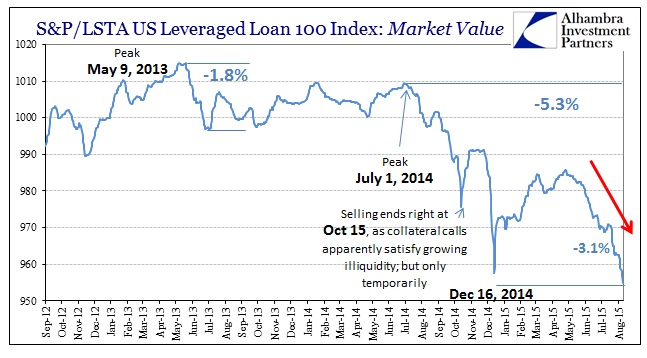
The S&P/LSTA Leveraged Loan 100 was updated this weekend through August 13, confirming that market values in those “liquid” names fell below the December 16 levels for the worst prices since before QE3. There isn’t any further information on the reasons for the delay, though revisions to the BofAML High Yield indices suggest an answer.
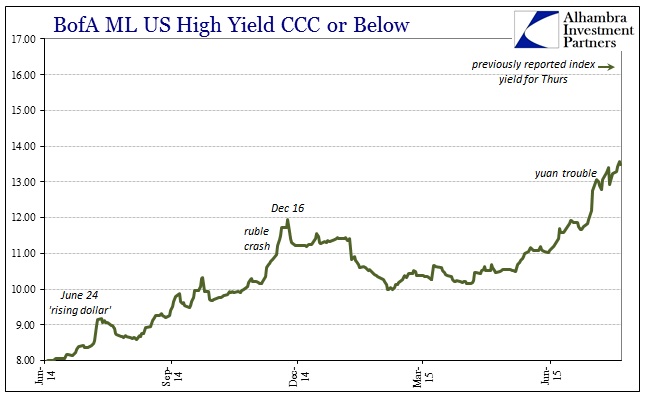
On Friday, the CCC and “below” index of junk bond yields surged to an alarming 16.18% from a clear selloff point Wednesday of 13.58% in yield. Over the weekend, that index yield has been revised for Thursday to just 13.49%; marking some buying interest and thus making Wednesday the apparent local nadir. That would actually be consistent with the repo index, as GC rates from DTCC peaked Wednesday not Thursday (though illiquidity measured by repo could certainly continue on even when repo rates decline, as happened immediately after October 15).
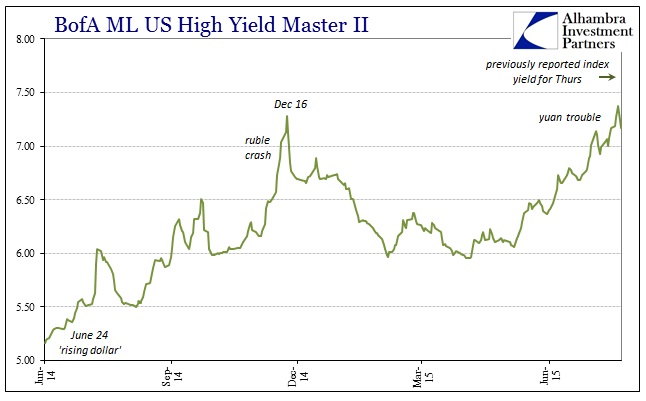
The BofAML Master II index, which is a junk bond yield estimate of less junk junk, was similarly revised to show the same Wednesday “dollar” run terminus; what was a yield surge/price selloff from 7.37% to 7.69% is now a bid to 7.17%.
In the end, the actual quantification of the “dollar” selloff may not be as important, since all three of these risky corporate bubble sectors were clearly under the same strain – so much so that pricing was obviously affected to a high degree in all of them. That may be the most relevant point of the run, namely that these are supposedly the most liquid names and securities as that is why they have been included in an index in the first place. If there were pricing problems on Thursday morning, lasting in part through the whole day, then it would more than suggest the serious nature of illiquidity continuing through the whole process.
This time, it was a great deal of potential damage that was revealed and that has to make leveraged participants (on both sides) more than a little uncomfortable. If that was enough to make the leveraged loan index go unpriced for days and the high profile junk index yields surge toward the sky to be revised days later, what might have been stirring in the less visible or liquid parts of the corporate bubble?
That was an issue for the period right after October 15, as the breakout in “dollar” turmoil was only the visible part of previously unnoticed (by most) difficulties. The system has not been the same since that day, which suggests both what I wrote above and what the Wall Street Journal wrote about the corporate space in the aftermath last October:
Corporate-bond investors have struggled this week to find trading partners for some large orders, causing unusual price drops and raising concerns that trading could freeze in future market turmoil.
“Buyers just disappeared” early Thursday for many low-grade bonds and even some higher-grade ones, said Jason Graybill, senior managing director at Carret Asset Management LLC, which oversees $2 billion.
“Future market turmoil” such as Wednesday/Thursday? How many uncomfortable and even panicky phone calls were there on Wall Street to produce all that? The pricing behavior here certainly suggests as much, revisions and updates notwithstanding. Since this “unusual” pricing environment extended/extends to much more than the corporate debt bubble in the US, going so far as to knock the PBOC into a financial daze, it is fair to interpret the “dollar” as once more taking on a financial run into acute disorder.
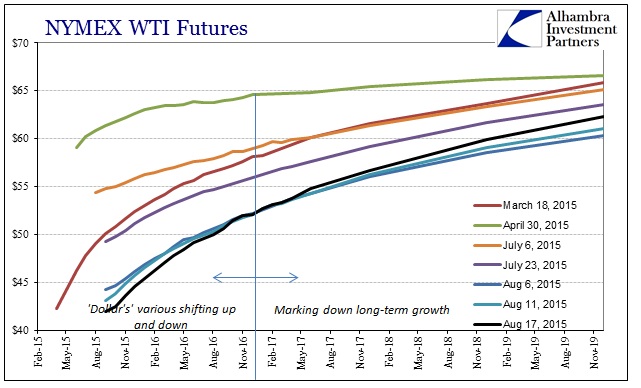
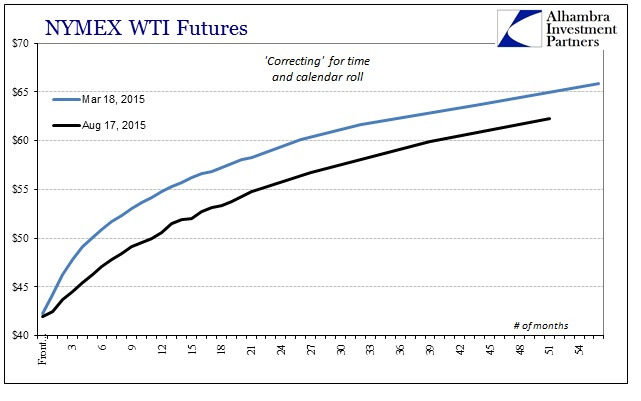
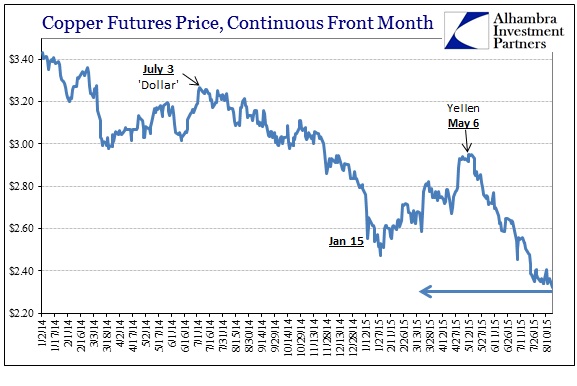
While that specific episode may have passed, maybe even relieved by the PBOC’s actions (like that of the SNB on January 15) that doesn’t mean all is forgiven. There is still the hard economic fact of deterioration as well as continued flailing in connected “dollar” markets. Both crude and copper suggest that at least aftershocks from last week’s run are still reverberating, particularly the WTI futures curve that remains far more active (to the downside) on the front end (the financial/”dollar” end) than the outer years; starting in recent days to take on the sharper and steeper curve more attuned to the “dollar” like that from March.
With repo rates up again today in agency and UST by 1.4 bps (though lower by 0.4 bps in MBS), it doesn’t seem as if the PBOC’s actions (even with a lower yuan fix these past few days) have had an inflective impact beyond just calming the most manifestly disrupted “dollar” segments – for now. Again, it has to be unnerving within the corporate bubble to see irregular pricing regardless, which has the same effect in dark leverage of rising VaR and volatility bands. That is, as has been since October 15, an effective monetary “tightening” to which the world remains ensnared.

Stay In Touch