
Economic Reports Scorecard – 8/17/15 to 8/28/15
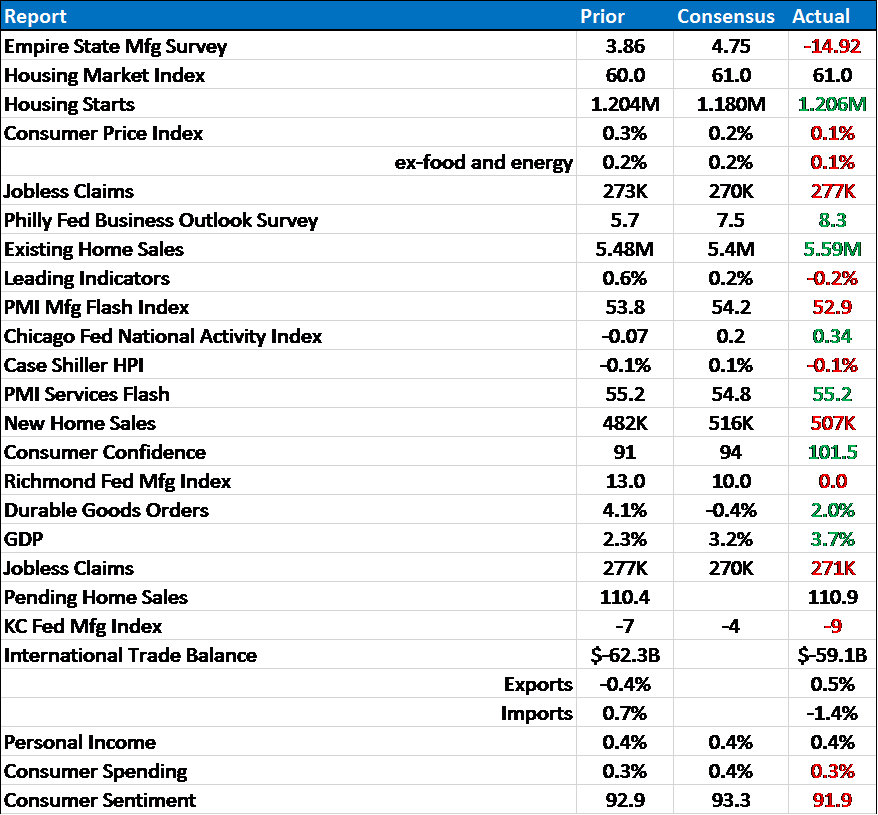
The economic data since my last update hasn’t changed much. I know that is getting boring to hear but it does have the advantage of being the truth. Manufacturing continues to struggle, housing is doing relatively better, inflation is dead and the consumer is struggling – although apparently confidently so. The jobs market is still okay, jobless claims still tracking under 300k a week. It all adds up to an economy that is plodding along at the same sedate rate it has for the last few years.
Our go to market indicators also haven’t changed much since the last update; most of them are still going in the wrong direction. The dollar index is still trading sideways after the big run up. It is either resting before another surge higher or about to collapse depending on which gloom and doom scenario you want to believe (that was a joke).
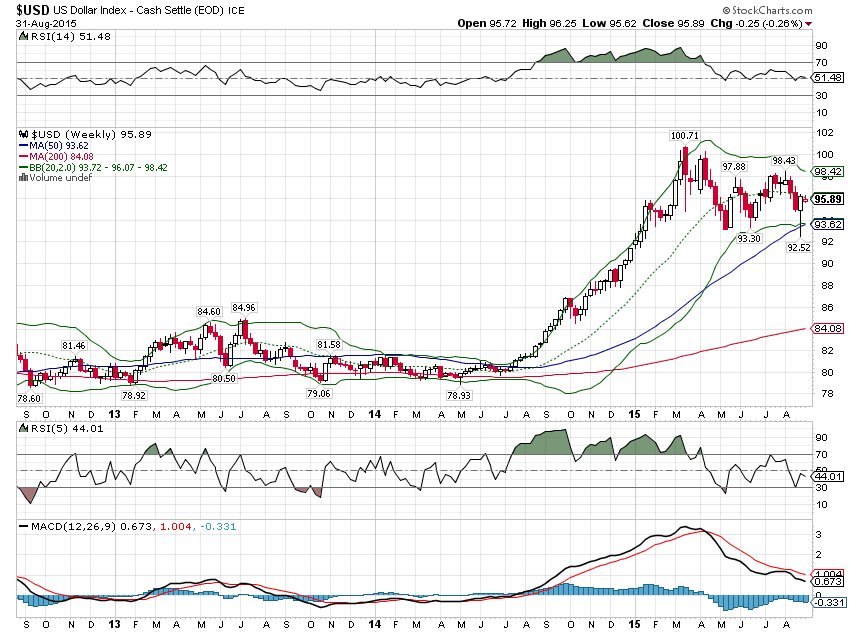
It is amazing when you think about all that’s been going on that the dollar hasn’t found a better bid. Of course, the dollar index doesn’t tell the entire story as it is mostly a Yen/Euro story. The dollar has been very strong against emerging market currencies as well as the so called commodity dollars – Aussie and Canadian. The strength of the Yen and Euro appears to be an artifact of the carry trade with the Yen and Euro the primary funding currencies and US assets the primary investments being financed. That doesn’t explain, however, what caused the carry traders to want to unwind positions all at once.
The popular explanation is that a slowing China is causing angst concerning global growth but frankly I find that explanation wanting. We just aren’t seeing any significant change in growth expectations from the bond market. The TIPS market is a good proxy for real growth expectations and despite what you may have read in the papers, TIPS yields have been rising, not falling:
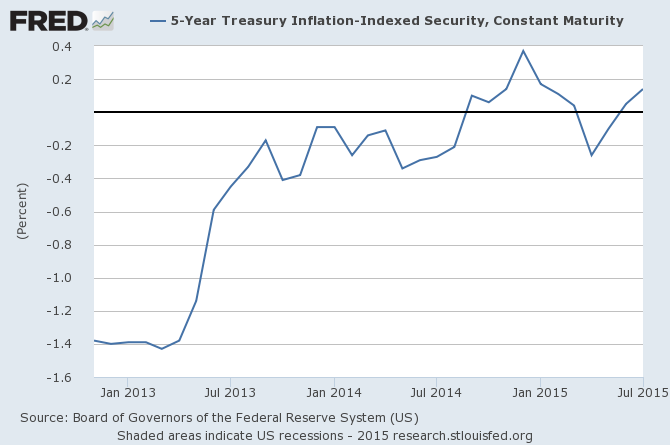
So, whatever it is that is spooking the leveraged carry traders, it apparently isn’t anything that is expected to affect US growth. Of course, as you can see, expectations for US growth over the next 5 years aren’t that high to begin with so maybe the stock market is merely adjusting to the reality that growth isn’t taking off as the Fed and everyone else keeps telling us it will.
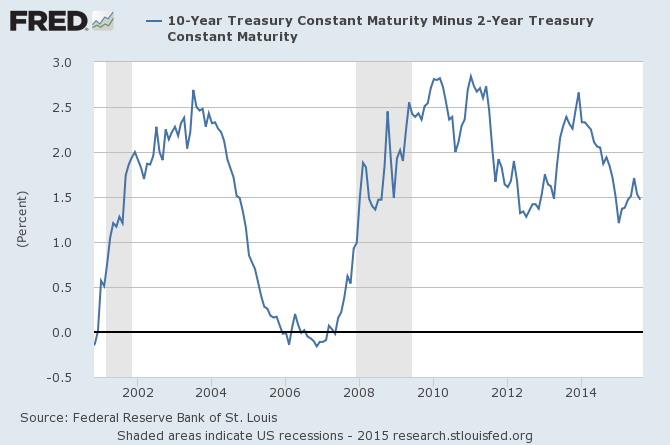
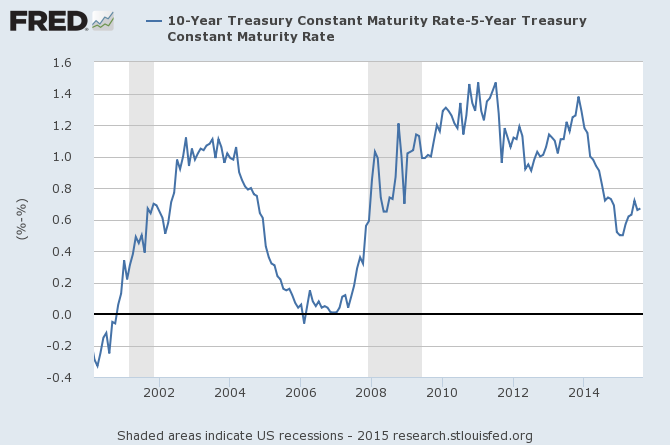
The yield curve steepened a tad since the last update but it doesn’t amount to much. That was probably a bow to reality as well since it appears the Fed may push off their rate hike to December or later. Whatever the case, the yield curve is still in the middle of its normal range indicating basically nothing:
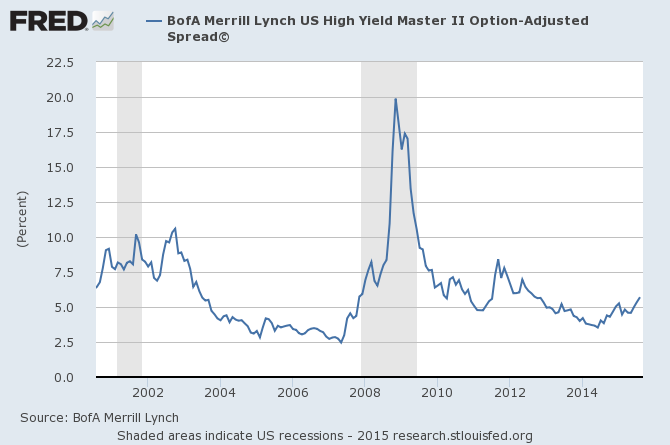
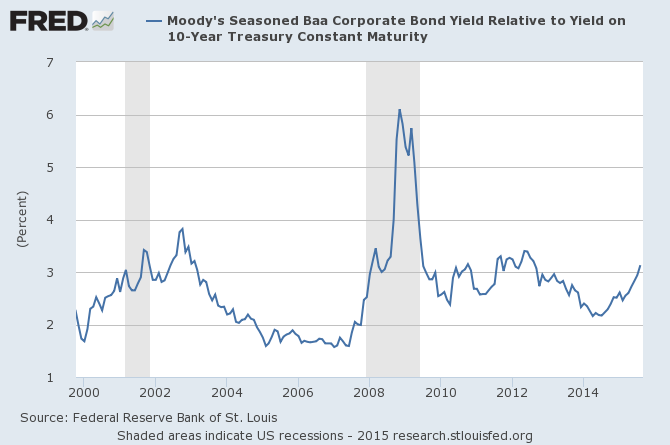
Credit spreads are still my biggest concern – by far. Spreads have continued to widen since the last update, across the credit spectrum. Most of the commentary I’ve seen tries to pin this on energy alone but that just doesn’t jibe with what I’m seeing in the markets. Spreads are moving wider across the rating spectrum and across a variety of industries.
And of course, with the widening of spreads we got exactly what history tells us to expect from the stock market when that happens:
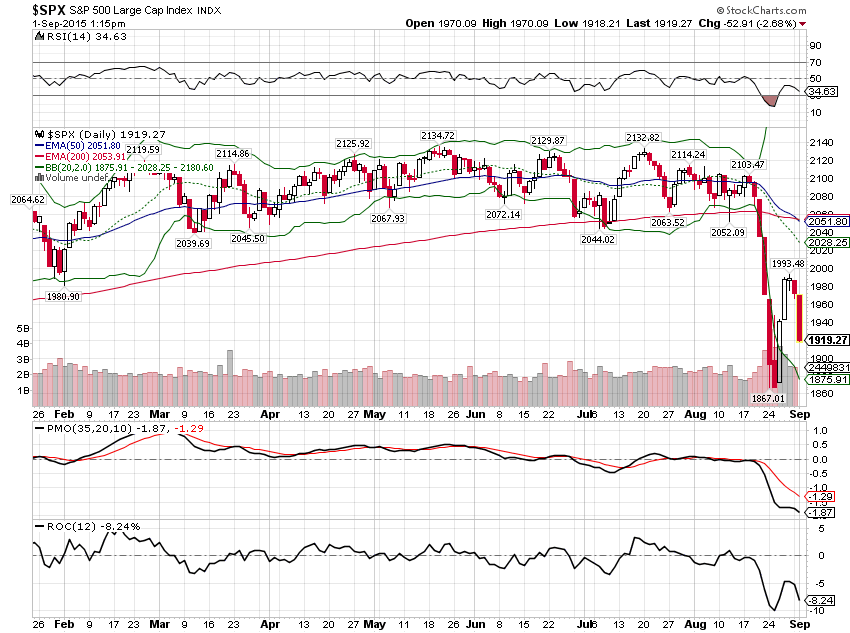
Stocks are a leading indicator themselves and the recent selloff, in combination with widening credit spreads, means that the risk of recession is rising. How much is something I can’t answer but caution is warranted until credit spreads start to narrow again. Widening spreads in a heavily indebted economy are not just a warning sign; they may well be the cause of recession, a self fulfilling prophecy of sorts. For sure, they aren’t to be ignored.
Stay In Touch