
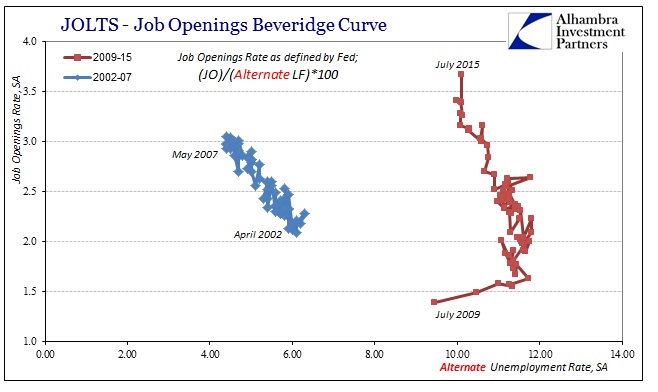
If on the fence trying to decide whether surging job openings or tailing hiring is the true representation of the economy (recognizing that these are not mutually exclusive propositions, just that it isn’t very likely they both coexist in anything but subjectively statistical fancy) Gallup just offered far more of the latter. Should actual job openings hold some kind of economic sway in terms of emotion, which is what economics assigns the higher probative value, you wouldn’t know from spending figures. And that works backward, as spending is supposed to be derived from rising and broadening wages which is what Job Openings (the BLS series) was developed to help determine.
According to Gallup, August was just ugly in a year of ugly. In fact, the August figures might be ugly bordering on concerning which would be an apt description of the economy apart from all the statistical prejudice.
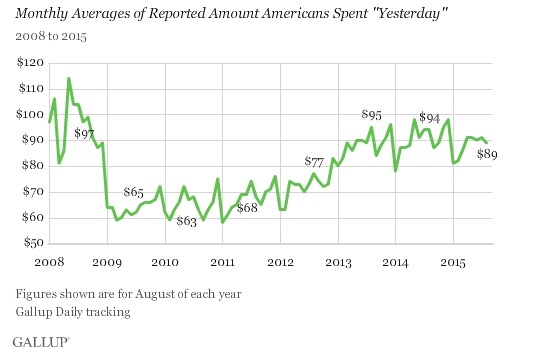
August 2014 was already $1 less than August 2013 which qualifies at least for stagnation. That is true even in the longer-term as August 2014 was $3 less than August 2008 when the worst actually started (the economy has shrunk). With that intermediate backdrop, August 2015 was significantly below last year; $5 certainly qualifies as that ugly bordering upon concern given that yearly change but also how it turns lower yet again this year where the only direction was supposed to be up, up and a lot more up.
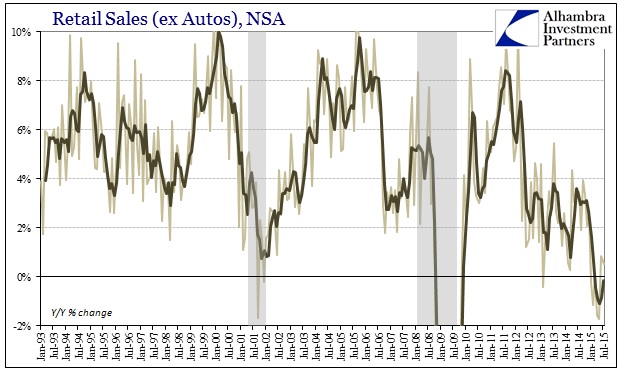
As an independently gathered and processed spending measure, it offers actual confirmation (rather than the incestuous circularity of the labor numbers) of less “adjusted” data such as retail sales, factory orders, durable goods, etc.; basically all the parts of the consumer economy that would/will contribute to the overall business revenue environment (which is why all the job openings?). As Gallup, almost everything slowed to a crawl or even complete stop around 2012 (Gallup shows it in consumer spending early 2013). The difference in 2015 is that flat trend giving way to at least a slight contraction so far. The distinction of a $5 decline this August is not just in potential magnitude but really that it reduces the chances of being derived from chance or sampling error; i.e., more likely it is a real and to this point durable trend.
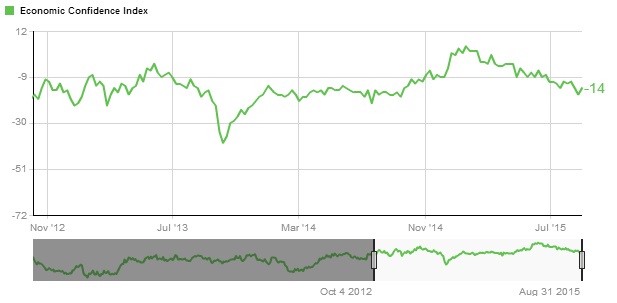
That point is further echoed by Gallup’s consumer “confidence” figures which continue to decline from their year-end perch. I have described before how I think that offers some compelling evidence toward disproving a great deal of economic theory surrounding recovery or growth based solely on the marginal effects of “confidence” (such as how the “wealth effect” might work). In other words, economists seemingly had everything they wanted in late 2014 (5% GDP, Establishment Survey at quickest expansion in decades, the FOMC quite ready to confirm it all by having already ended QE and then ZIRP within short order, global central banks all saying practically the same for their jurisdictions and thus the global order, etc.) to the point that Gallup’s confidence estimate (as well as several others) surged to new cycle highs. And it all amounted to nothing more than empty feelings.
At -14 and falling, that figure isn’t appreciably different than 2014 or even late 2012 when this real slowdown all began (and the recovery, ostensibly whatever it was, ended). The fact that Gallup is picking up the same trend at the same time and even to what looks like the same intensity as the Census Bureau’s retail sales estimates is a lot more persuasive than the BLS trying to shoehorn Job Openings into a Beveridge Curve framework that may not in any way apply.
Stay In Touch