
The theme since August 24 in wholesale funding, eurodollar and Asian “dollar”, has been that even the global and intense liquidation was not enough to square the mighty imbalance that has been building. It’s a frightening prospect, but in money markets everywhere that is the only interpretation left. The media, unable to make heads or tails, finds small nuggets of accounts that seem to fit actual events while most importantly preserving the idea the “dollar” world hasn’t endured in the middle of almost open chaos. That last part “can’t” be because the Fed and economists keep saying it is impossible.
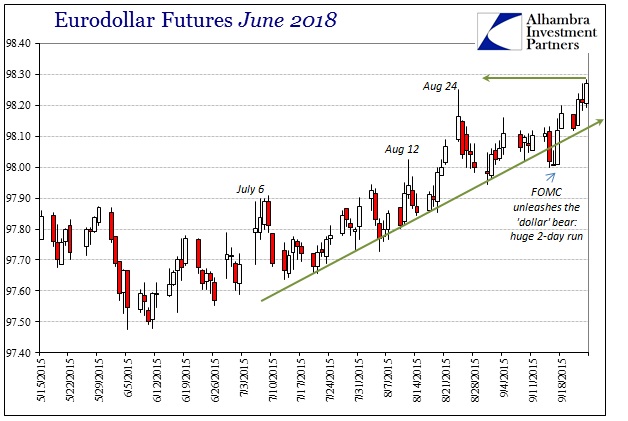
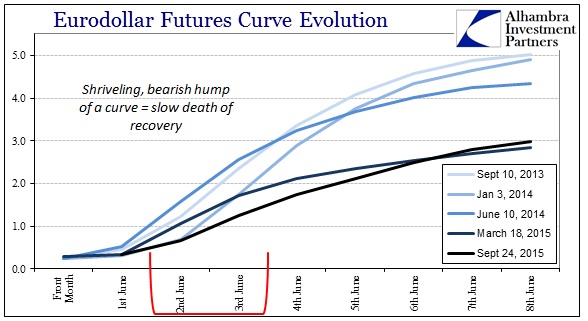
I focused yesterday on the eurodollar futures curve which has been about as conclusive as it gets – almost. The twin and very related market next to eurodollar futures is interest rate swaps. Where eurodollar futures are confirming the ugly, interest rate swaps are maybe even a step beyond.
First, some relevant history. The interest rate swap rate is quoted as the counterparty paying fixed to receive some floating (usually tied to LIBOR, which is why eurodollar futures are entangled). Since there is credit risk involved in counterparties, it had always been assumed that the swap rate would have to trade above the relevant UST rate since the US government is assumed to be without it. That all changed during panic in 2008:
October 23, 2008, was an unusual day in credit markets even within a vast sea of unusual days. Credit and “exotics” desks at banks were left scrambling to figure out how it was possible that the 30-year swap rate could trade less than the 30-year treasury. It was thought one of those immutable laws of finance that no such might occur, to the point there were stories (apocryphal or not, the tale is about the scale of disbelief) that some trading machines were never programmed to accept a negative swap spread input. The surface tension about such things was decoded under the typical generalities that stand for analysis; if the 30-year swap spread was negative that might suggest the “market” thinking about a bankrupt US government.
A negative swap spread on its surface seems to indicate that the “market” views counterparty risk as less than risk of investing in the same maturity UST. That was never the case, however, as bank balance sheet capacity was simply collapsing leading to all sorts of irregularities; thus the problem of mainstream interpretations that stay close to the surface rather than recognize the wholesale origin (chaos and disorder) beneath. On the basis a comprehensive view of the 30-year swap spread, the sea of illiquidity is brightly and fully illuminated as once more “dollar waves” crashing the global financial system – the second much more devastating than the first.
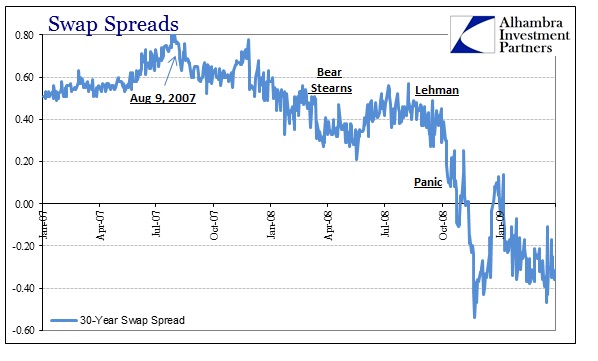
Worse, as you can see plainly above, there was a third “dollar” wave that started in early to mid-January 2009 well after TARP, ZIRP and even QE1 (once more dispelling any heroics on the part of economists at the Fed who still had no idea what to do), accounting for the final crash to the March lows.
So you can begin to fill out the broad picture as October 2008 wore on, even though the worst of the broader market panic seemed to have been left behind. The demand for fixed side hedging was only increasing as the money dealers were both withdrawing and being unwritten in their assumed steadiness (not just ratings downgrades but very visible capital deficiencies and worse in terms of extrapolations at that moment). It was in every sense a rerun of the credit default swap reversal that had nearly brought it all down in March 2008 and then again with Lehman, Wachovia and, of course, AIG that September. In short, the “buy side” was in desperation for more hedging lest their portfolios and leverage employments tend too far uncovered while the dealers were in no position to supply it; desperate demand and no supply means prices adjust quite severely, which in this case pushed the swap rate, the quoted fixed part, below the UST rate for the first time ever (not that the swap rate history was all that long by then).
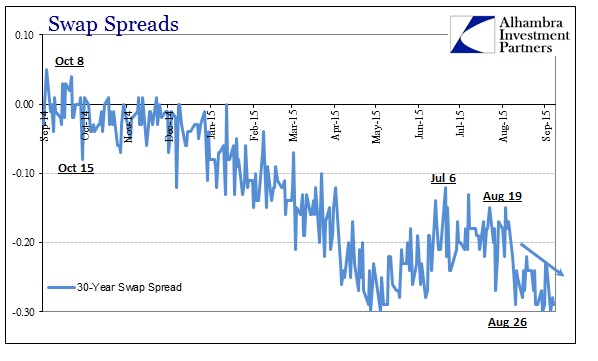
One main point of emphasis for that column was that every time this occurred thereafter there was a mainstream attempt to dismiss it while simply assuming some benign explanation dutifully quoting the usual “fixed income trader.” When swap spreads turned negative again in early 2010, for example, media stories of corporate fixed income volume filled the space to assure that all was still quite well; obviously it wasn’t given what happened not long after. Loyally replaying that very same tendency, earlier this year we received the same bland message, “ignore the turn in swaps because it’s just fixed income being more normal.”
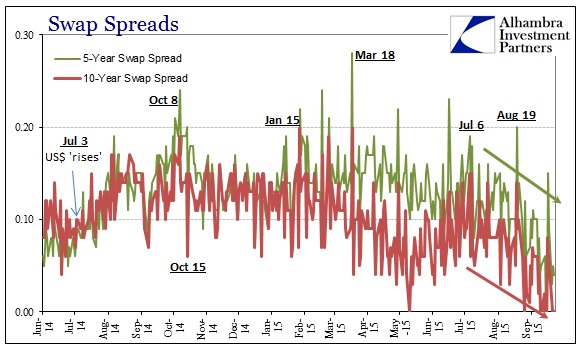
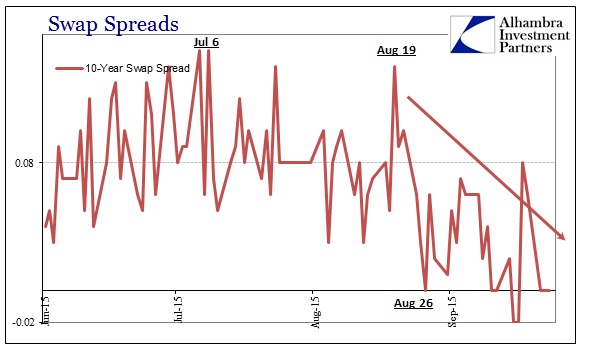
Any actual catalog of swap spreads, especially since the “dollar” began “rising”, shows that to be utterly false. There is nothing at all benign about negative spreads, especially now, after August 24, where they are still sinking in every maturity.
It isn’t just the 30s, again, as this sinking has infected even the benchmark 10s and further up into the short end maturities (while the spread of spreads, 10s minus 5s, continues to expand).
In what might be the most conclusive indication of illiquidity in the entire spectrum of them, and the most troubling, the compression in swap spreads could not be more clear in terms of interpretation at the 2s:
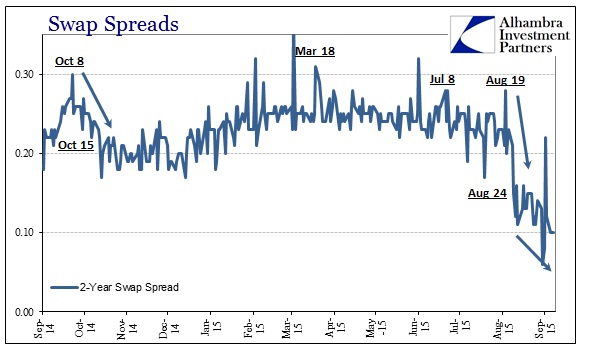
Either corporate issuers suddenly decided that the week after August 19 was the perfect time to issue at maximum (because companies always float more debt during global liquidations?), or dealer capacity was so strained that it broke open all the way down to the 2-year maturity in swaps. And the truly disturbing part, again, where all the very dark interpretations lie, is what has occurred thereafter, namely that spreads are still decompressing everywhere more than a month afterward. Either companies are going nuts at worse spreads and prices (think leveraged loan prices and even AAA-spreads) or dealer-driven liquidity is seriously and durably impaired.
In that view, the eurodollar curve is confirmed as are junk bubble prices and even stocks that can’t seem to gain any footing in the aftermath (though, we are told repeatedly, they “should” have). You can only claim this is “normalizing” behavior if you accept that “normal” is the eurodollar decay and that illiquidity is the actual base condition; which it is proving to be as QE fantasy is the aberration.
Heading toward the quarter end, this should be quite concerning rather than, like LIBOR, ignored or rationalized yet again as if it were welcome and expected.
Stay In Touch