
What should be written about GDP has nothing to do with whether 1.5% is meaningfully different than 3.9%. Everything gets focused upon the quarterly variations and, often intentionally, loses all that is important about the economic context. That 1.5% is weak and ineffectual, but that it continues the string of irregular and unstable approximations is all that truly matters; especially as GDP is the one account constructed most charitably toward delivering an optimistic number. With its heavy emphasis on imputations and trend-cycle subjectivity, the fact that GDP has continued on a conspicuously uneven track reveals everything we need to know about economic conditions.
That starts with, in my analysis, the great likelihood that the lumpy surge of the past two years (Q2 this year; Q2 & Q3 last year) are going to find the same disappearance as the unevenness originally presented about 2012 and 2013. The instability more than suggests now as it did then, only the BEA refused to acknowledge that until forced by “unexpected” benchmark revelations. That is the pertinent element of GDP as far as predicting, as much as it might, the future course of the US economy.
In truth, we don’t need to go that far in order to understand the current and immediate predicament. With all its imperfections, GDP delivers the unwelcome news in its past performance for anyone wishing to see it. The fact that so many dwell only in the current number has allowed this deficiency to protect and bolster the monetarist case that has so stunningly bombed. Worse, Ben Bernanke is trying to frame the results of GDP as “proof” that his “courage” rewarded all of us; it is highly disingenuous and worse, since if he is successful in convincing at least those politicians already in alignment to judge him and his monetary brand along these lines it will only further hinder actual recovery and long run economic health. That is the great reductionism of this age of less obvious inflation, where he should turn total disaster into shining success prevents recognizing and appreciating necessary changes.
As with the “dollar” and money dealing, GDP actually proves the opposite of Bernanke’s case in every way imaginable. He plainly states his view as (from his October 4 WSJ op-ed):
Europe’s failure to employ monetary and fiscal policy aggressively after the financial crisis is a big reason that eurozone output is today about 0.8% below its precrisis peak. In contrast, the output of the U.S. economy is 8.9% above the earlier peak—an enormous difference in performance.
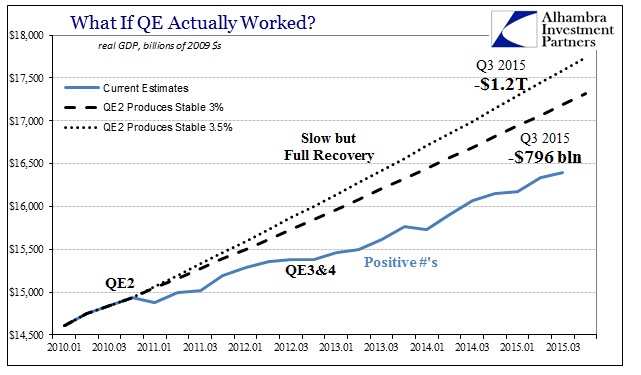
The implication is that because Europe conveyed no peak-to-peak growth while the ECB only reluctantly (in his view, as if the 2010 SMP’s and 2011 LTRO’s were nothing much) embraced various monetary intrusions and the US “achieved” 8.9% (actually 9.4% as of Q3’s current estimation) whereas Bernanke was all-too-eager to intrude repeatedly that defines QE’s economic deliverance. What he neglects to mention is the 31 quarters it took to find even that level.
The relevant comparison is not, then, to Europe’s recovery but our own prior cycles. In reviewing that context you can only conclude that there is really no distinction at all between what the Fed “delivered” and what the ECB failed to do; they both miscarried, badly. The relevance of Q3’s 1.5% is only that the US economy continues in that malaise, which the FOMC is truly forced to admit in inaction meeting after meeting.
What is utterly amazing, and damning, is that the US economy in the past nearly eight years has so drastically underperformed the worst parts of the Great Inflation. The 1973-75 recession was itself severe and protracted, but what followed was such a malignancy of financial conditions that it, by only 1980, had convinced a bipartisan Washington establishment to completely abandon Keynesianism and its New Age versions of soft central planning.
Bernanke’s Fed has done far worse, though the restored Keynesianism combined with monetarism (as if they were ever all that different) remains not just dominant but without any consideration whatsoever toward reform. The media and the political engines still, somehow, refer and defer to these economists as if they can deliver, or that they even have the slightest idea about what goes on in an economy. They can create and combine some truly breathtaking statistics and mathematics, undeniably elegant stuff, but the fact of the results presented below demonstrate inarguably, conclusively and without counter that such beauty and majesty in regression and equation amounts to diddly squat.
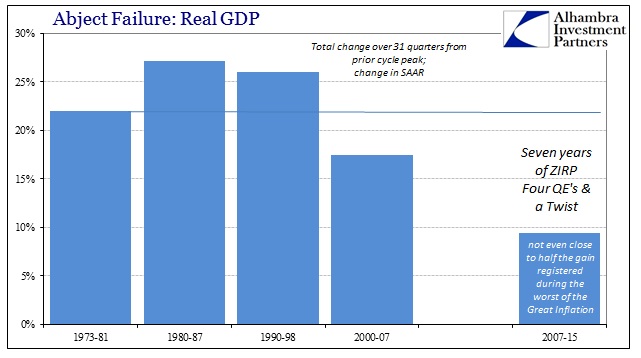
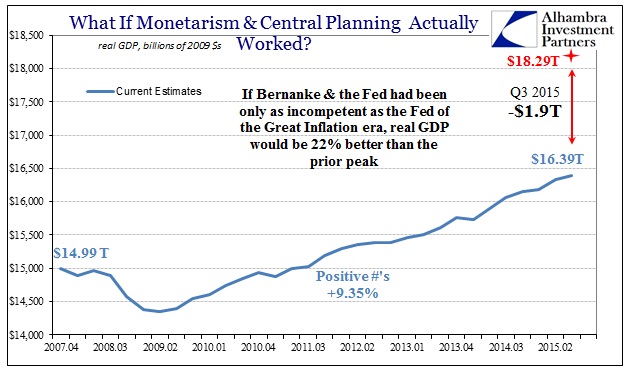
From 1973 through to 1981 (and the complete front end of the early 1980’s double dip), the same timeframe of 31 quarters, real GDP in the US advanced about 22% total. Again, this was during what is universally reviled not just in economic history, but social and political context as well. That is more than twice the level attained over the past 31 quarters to Q3 2015.
The fact that the Great Recession was deeper and longer actually works against Bernanke and the orthodoxy, as neither of the two mainstream business cycle theories would predict this disaster (this post is as a companion to my weekly essay, which takes this point in more detail here). In other words, the recovery should have been that much sharper given the size of the recessionary hole (symmetry), and thus by the passage of just about eight years there is no reason to think the economy would not be at least equal let alone a shriveled mess compared to the Great Inflation.
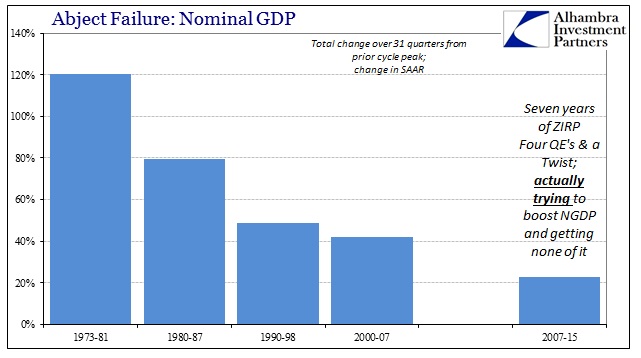
When you start adding other mainstream statistics to the comparison, the indictment only gains. The entire point of QE and ZIRP is to engender “inflation”, to the point of being almost NGDP targeting (only without a hard target). Yet, for all the Fed has done it has delivered none of it. The incompetent Fed of the Great Inflation tried as much as their rigid ideology allowed to avoid consumer price explosion and only succeeded in gaining more, while the current incompetent Fed attempts everything and the kitchen sink to get even a little and finds almost none. From that view, we can start to really appreciate the problem as outside the economy but not as secular stagnation would have it, rather instead the alarms of maladjustment point uniformly across history at the central bank, and only the central bank.
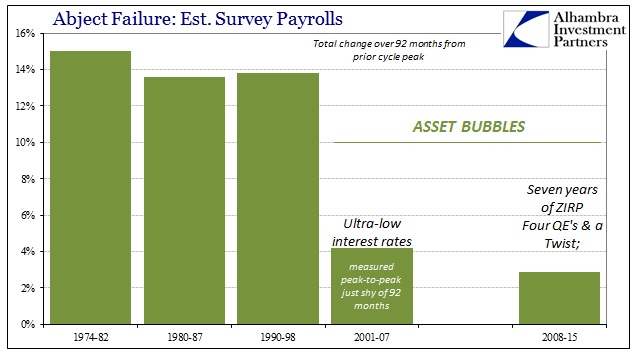
Even adding the Establishment Survey to the catalog only embarrasses Bernanke further, despite the suspiciously uncorroborated “best jobs market in decades.” For all the fuss and fury supposedly of the past year and a half, the state of labor gains is only tragic; which is, obviously, completely in agreement with both RGDP and NGDP as shown above.
From all this, we can actually measure how badly the Fed undershot the Great Inflation; and it is staggering. If the US economy had gained only what resulted in the later 1970’s despite a dollar crisis, oil and energy disruptions and punishing financial elements it would be almost $2 trillion greater by now. That is the cost, in rough equivalence, of Bernanke’s “courage.” Needless to write, but the actual labor market would be radically different in that circumstance, certainly fostering maybe a fraction of the common frustration and growing unrest of “Main Street.”
What matters of the GDP report is its backward calculation of the huge cost of lost time in following a monetary course that was actually and completely discredited and disqualified by the last cycle (if not the one before that). Economists wish only to wallow in the narrowest of comparisons for that reason alone, which sheds only greater light on Bernanke’s arrogance that he would stray outside of that to recount some disingenuous dignity for himself. That’s how you know, without doubt, QE failed and spectacularly. If it had succeeded, the former Fed Chair would not have needed to risk opening this door.
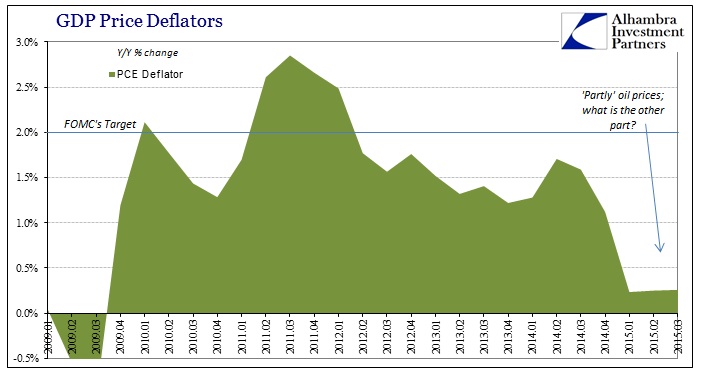
Finally, the GDP report included more bad news for Bernanke’s successor and her quixotic insistence about anchored long run inflation expectations. For the third consecutive quarter, the PCE deflator was +0.26% or less. As if the ongoing money market and “dollar” debacle aren’t enough, yet again we see clearly and wholly that they really don’t know what they are doing.
Stay In Touch