
Any reasonably or relatively objective view of the Bureau of Economic Analysis’ estimates for PCE and Personal Income (personal income and outlays) render more questions than answers; more doubts than satisfaction. For one, the series continually undergoes not just heavy revisions and not just at the benchmark continuities, but all over the place. Further, these revisions, particularly between income and spending, produce far more disharmony than corroborative sample.
The BEA has made a cyclical habit of revising income higher especially as outlays conspicuously lag. In the October 2015 update, there were upward revisions to every month going back to March. This is in contrast to the last benchmark revisions which saw a great deal of personal income “disappear.”
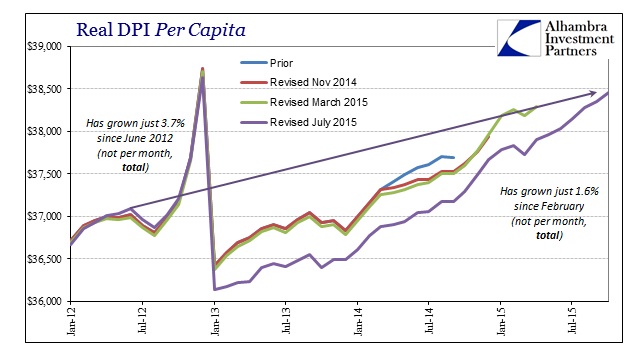
What was just 2.4% total real DPI per capita growth (thru September) since June 2012 is now 3.7%. In reality, as detailed at last month’s PCE update, that amounts to splitting hairs since the “typical” cyclical recovery in real DPI per capita is more than two or three times even this revised absolute growth. Therefore, these revisions don’t really say much about the state of an accelerating recovery so much as the statistics that seem determined to find one.
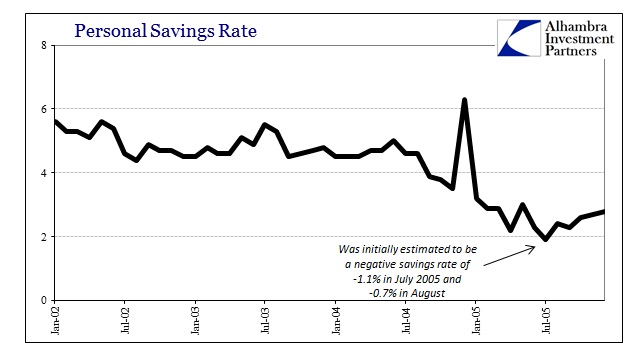
For all the fuss about those arithmetical estimates for income gains, there was no corresponding increase in spending; revisions or otherwise. That leaves the personal savings rate, which is the leftover between them, rather visibly all over the place in trying to define some kind of trend for actual consumer preference and ability.
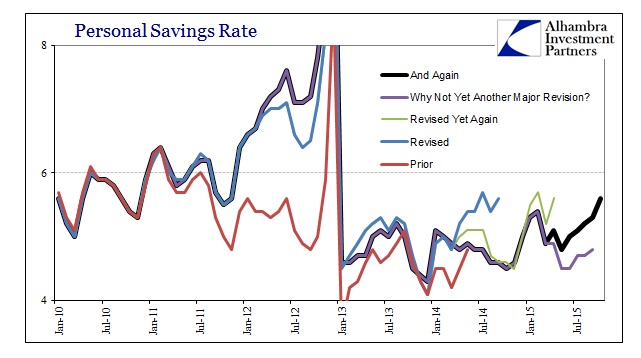
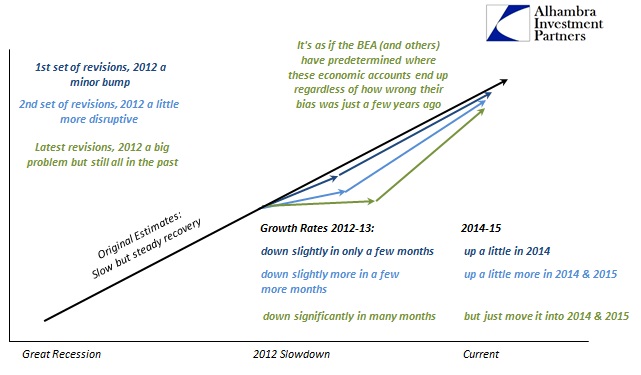
That muddled mess, especially after the major benchmark revisions from 2012, is perhaps the best demonstration of the statistical difficulties facing these economic accounts that are simply accepted as fully determinative. Nowhere is that point more acute than those 2012 revisions, as you can plainly see where they intersected with PCE and Personal Income in the Personal Savings Rate revisions for that year.
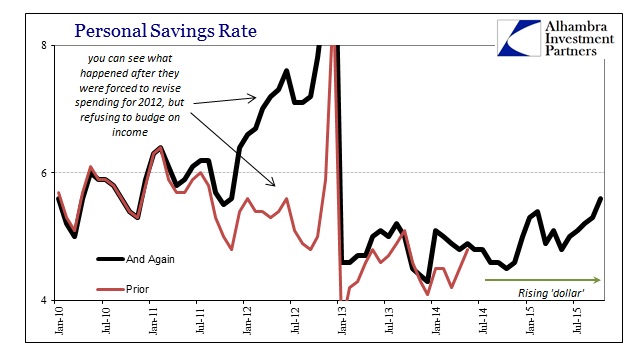
In other words, the BEA was rather sure there was commensurate spending growth to their view on income in 2012, yielding an uneven but unmistakably downward path in the savings rate, only to be foiled by more complete and shockingly weak benchmark revisions. Thus, as now, the difference between spending and income became large and larger, until the savings rate was then “forced” (by unyielding income revisions) much, much higher. That is the same view as being projected at the moment without any benchmark alterations this year.
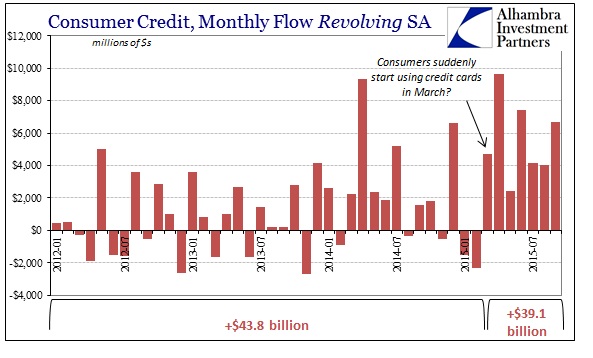
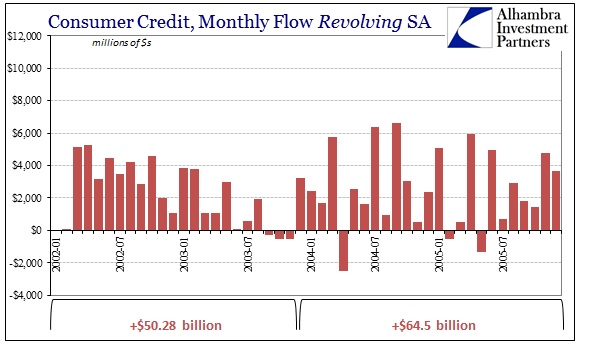
That produces another strange dichotomy as we know that consumers since March have suddenly taken to revolving credit. Such debt appeal is usually reserved for periods of a declining savings rate except where consumers are left with no other options; the rising savings rate being consistent with only the latter. Economists wish to see 2005 in that debt window but are confronted, yet again, with a far more consistent opposite interpretation. In fact, debt usage did surge in 2005 concurrent to a sharply declining savings rate (which was actually initially estimated to be negative), projecting exactly that kind of consumer recklessness by which the Fed has been desperate to engineer (and official statistics with it by force of their trend-cycle subjectivity).
In 2005, to be sure, consumers were far more indebted via mortgages than just revolving or even overall consumer credit, but the proclivities in all facets easily aligned and therefore offered compelling arguments about a positive, if artificial, economic state. From that we can reasonably infer that the difficulties over estimating the savings rate these past few years flow from the plain lack of repeated harmony and therefore “something” not quite right with the “recovery” idea.
If there were a true recovery and accelerating economy, in other words, then there would be no such continuous and major inconsistencies in these figures. Their alignment would be much more of a sound basis to offer such a conclusion. That doubt even extends into the sorrowful state of spending beyond its inconsistency in terms of income.
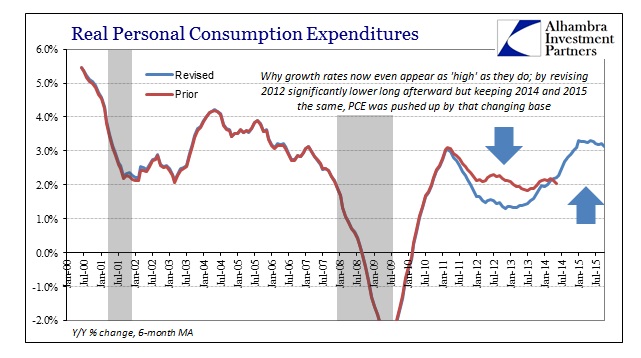
That point also begins in the 2012 benchmark revisions. As noted on prior occasions, those revisions were treated very curiously with regard to especially 2014 estimates. While spending accounts, in particular, were seriously marked down because of the 2012 Economic Census, estimates for 2014 and early 2015 were not much altered. That had the exposed effect of increasing growth rates for 2014 due to nothing more than the altered 2012 and 2013 base. Since almost every economic account is “chained” statistical variation, the fingerprints of subjectivity are quite exposed (in short, if you revise lower a benchmark continuity point then everything thereafter, being chained monthly volatility, must follow; the BEA in spending figures did not do that, seemingly starting from a pre-determined level of spending for 2014 and 2015 and then backwards bootstrapping growth rates to make it so).
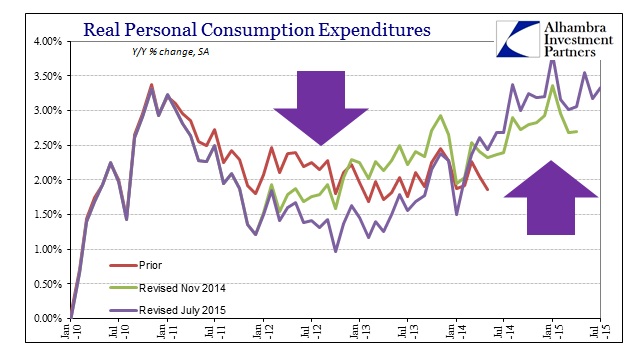
These “real” PCE figures have the further problem of being aided by a near-zero PCE deflator throughout 2015. That leaves the growth rate for the past few years as purely base effects from revisions of past over-estimation as well as “inflation” falling directly against what economists expect of rising activity. The behavior of nominal spending, by contrast, is certainly more evidence of that inconsistency.
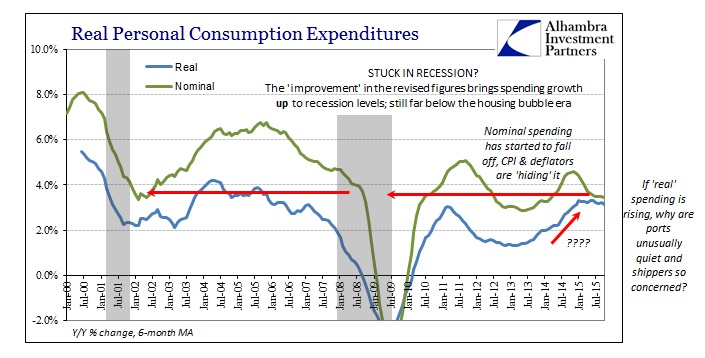
Nominal spending continues to be, quite simply, putrid (even though it, too, underwent the same revised processes as described above for real spending). Economists will make the argument that even lower nominal spending might still translate into greater economic activity; pay less, get more. However, actual, non-stochastic observations (port traffic, shipping rates, freight volumes, etc.) of late quite exactly refute such a suggestion, leaving again only “services” to supply the possibility of true economic gains. And even that falls apart, setting aside all those imputations and conjured estimates; if actual increases in service spending are coming at the direct expense of spending on goods then it is still a highly negative commentary upon the actual state of the economy.
Further, that would suggest nothing good about the immediate future as the goods economy is the leading edge of economic flow, while services are the historical lag (most especially “service spending” estimated by the highly dubious “owner’s equivalent rent”).
That leaves a whole lot of inconsistencies that cumulatively suggest only one adjustment in economic interpretation. Even before digging into the internals of all this, spending remains substandard and highly confusing. The statistical mess apart from that suggests then that spending is merely worse than presented, which is far more aligned with observations across the less-adjusted views on the economy. Nominal spending in October 2015 gained just 2.9% Y/Y, which is really quite bad, equal to September 2008 and worse than all of the dot-com recession (and its aftermath) except the 2.0% Y/Y nominal growth for September 2001.
That is the baseline for economic interpretation and extrapolation. With retail sales similarly compared with the dot-com recession, it would appear that neither services spending, calculated inflation nor the jumbled mess of statistics thereafter are effective alterations to that meaning and significance. If there is income growth this year, there isn’t any spending; worse, what spending is already estimated is already problematic by many counts. Thus, we are back to questioning the income once more, which is typical since the economy certainly isn’t behaving in yet another year as if income is accelerating.
Consumer spending inched up last month, rising at a rate well below expectations, as cautious Americans saved more of their growing incomes, the Commerce Department said Wednesday.
Personal consumption expenditures increased just 0.1% for the second straight month. Economists had expected a 0.3% increase.
The slow pace of spending by consumers — a category that accounts for about two-thirds of U.S. economic activity — could be a warning sign to Federal Reserve policymakers as they consider whether to hike a key interest rate next month.
Stay In Touch